
Mathematics, 31.12.2020 06:50 braydenaddison738
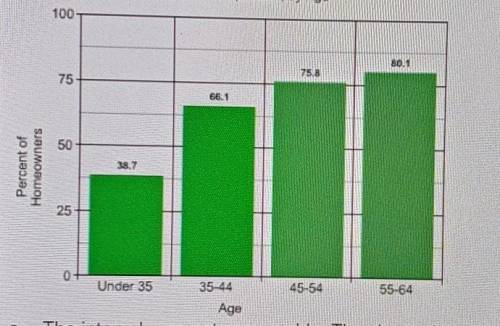
Use the graph below. Explain why the intervals on the horizontal axis could make the graph misleading
45.54
a. The intervals are not comparable. The shorter bar spans more than 10 years
b. The intervals are appropriately labeled
c. The intervals are not comparable, but the data on the graph is not misleading
d. The vertical axis does not have an appropriate scale

Answers: 3
Another question on Mathematics
Mathematics, 21.06.2019 22:00
(01.04 lc)multiply 1 over 6 multiplied by negative 1 over 2. negative 1 over 3 negative 1 over 12 1 over 12 1 over 3
Answers: 1
You know the right answer?
Use the graph below. Explain why the intervals on the horizontal axis could make the graph misleadin...
Questions


Biology, 19.04.2021 23:38
Mathematics, 19.04.2021 23:38

History, 19.04.2021 23:38
Mathematics, 19.04.2021 23:38
Mathematics, 19.04.2021 23:38
Mathematics, 19.04.2021 23:38
Biology, 19.04.2021 23:38


