![\displaystyle [-6, -2], [1, -1], [2, 0], [3, 1],](/tpl/images/1008/4082/7ea90.png) and
and ![[10, 2]](/tpl/images/1008/4082/f7822.png) are all touched on this graph, letting you know that this information is accurate.
are all touched on this graph, letting you know that this information is accurate.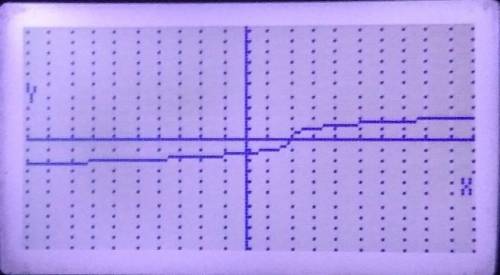
Graph the funtion f(x) = .
(I added a picture just in case you can't read the equation)
...

Mathematics, 28.12.2020 07:30 cclangston
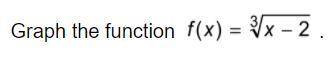
Graph the funtion f(x) = ![\sqrt[3]{x - 2}](/tpl/images/2035/3509/65b4c.png) .
(I added a picture just in case you can't read the equation)
.
(I added a picture just in case you can't read the equation)
Struggling a lot could use a friend right about now thank you

Answers: 2
Another question on Mathematics
Mathematics, 21.06.2019 16:00
Find the equation of the trend line (line of best fit). show your work i'm using the points (34,76) (42,91)
Answers: 2
Mathematics, 21.06.2019 16:50
Factor -8x3-2x2-12x-3 by grouping what is the resulting expression?
Answers: 2
Mathematics, 21.06.2019 17:00
Use the frequency distribution, which shows the number of american voters (in millions) according to age, to find the probability that a voter chosen at random is in the 18 to 20 years old age range. ages frequency 18 to 20 5.9 21 to 24 7.7 25 to 34 20.4 35 to 44 25.1 45 to 64 54.4 65 and over 27.7 the probability that a voter chosen at random is in the 18 to 20 years old age range is nothing. (round to three decimal places as needed.)
Answers: 1
Mathematics, 21.06.2019 17:10
Consider the following equation -167 + 37 = 49 - 21p select the equation that has the same solution as the given equation. o a. p - 5 + ip = 7 - p ob. +55 + 12p = 5p + 16 c. 2 + 1.25p = -3.75p + 10 d. -14 + 6p = -9 - 6p reset next
Answers: 3
You know the right answer?
Questions


Mathematics, 19.05.2020 13:59

History, 19.05.2020 13:59
Mathematics, 19.05.2020 13:59
Mathematics, 19.05.2020 13:59

Biology, 19.05.2020 13:59

Mathematics, 19.05.2020 13:59

Mathematics, 19.05.2020 13:59
Mathematics, 19.05.2020 13:59
Mathematics, 19.05.2020 13:59

Spanish, 19.05.2020 13:59


