
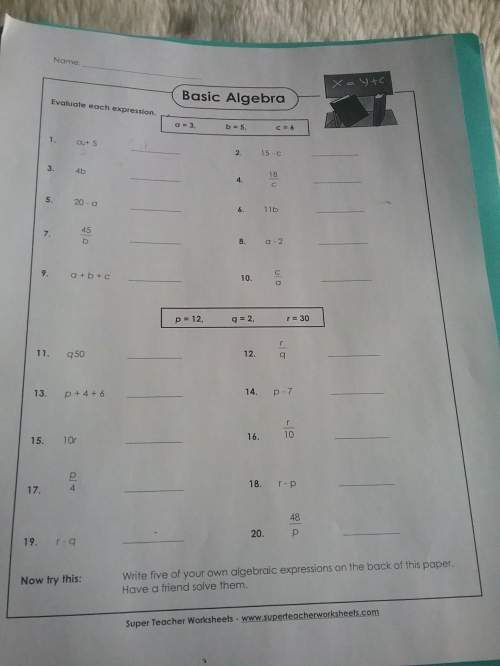
Mathematics, 22.12.2020 21:40 vane1161
Select the correct answer.
The graph below shows the quadratic function f, and the table below shows the quadratic function g.
x -2 -1 0 1 2 3 4
g(x) -1 0.75 2 2.75 3 2.75 2
Which statement is true?
A.
The functions f and g have different axes of symmetry and different maximum values.
B.
The functions f and g have the same axis of symmetry and the same maximum values.
C.
The functions f and g have the same axis of symmetry, and the maximum value of f is greater than the maximum value of g.
D.
The functions f and g have the same axis of symmetry, and the maximum value of f is less than the maximum value of g.

Answers: 1
Another question on Mathematics
Mathematics, 21.06.2019 13:00
The polygon tool to draw a rectangle with a length of 5 units and a height of 3 units. one of the sides of the rectangle falls on line ab , and the rectangle has a vertex of a. each segment on the grid represents 1 unit.
Answers: 1
Mathematics, 21.06.2019 18:50
The random variable x represents the number of phone calls an author receives in a day, and it has a poisson distribution with a mean of 8.7 calls. what are the possible values of x
Answers: 1
Mathematics, 21.06.2019 23:30
The legs of a right triangle measure 6 meters and 8 meters. what is the length of the hypotonuse.
Answers: 1
You know the right answer?
Select the correct answer.
The graph below shows the quadratic function f, and the table below show...
Questions
Mathematics, 01.06.2021 03:20


Spanish, 01.06.2021 03:20

Mathematics, 01.06.2021 03:20

Mathematics, 01.06.2021 03:20

Computers and Technology, 01.06.2021 03:20

Chemistry, 01.06.2021 03:20
Mathematics, 01.06.2021 03:20
Mathematics, 01.06.2021 03:20


