Scenario: Boa Constrictor Population
Instructions:
View the video found on page 1 of th...

Mathematics, 22.12.2020 03:00 cgarnett5408
Scenario: Boa Constrictor Population
Instructions:
View the video found on page 1 of this journal activity.
Using the information provided in the video, answer the questions below.
Show your work for all calculations.
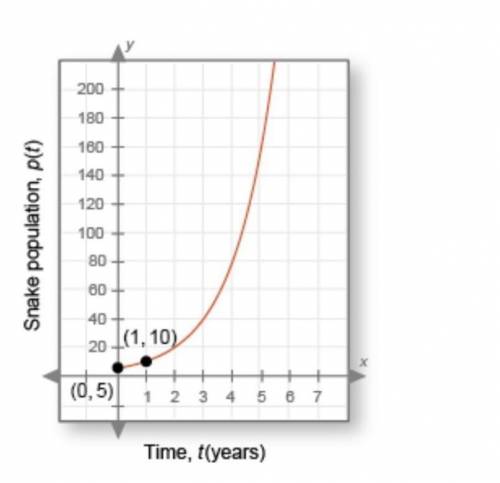
Below is the graph of the boa constrictor population you learned about in the video. The x-axis is t, the time in years, and the y-axis is p(t), the snake population for any given year. In this case, t = 0 indicates the year they started keeping track of the constrictor population. Scientists want to know how the population is changing every two years so they can make predictions about the future.
Analyzing the Data:
1. Is this graph increasing or decreasing? Does this imply that the boa constrictor population is growing or diminishing? (1 point)
2. Looking at this graph, would you agree that the boa constrictor population could become a problem? (1 point)
3. What is the horizontal asymptote of this graph? (1 point)
4. What is the domain? Explain. (1 point)
5. What is the range? Explain. (1 point)
6. What is the y-intercept? What does this mean in terms of the snake population? (1 point)
7. What is the point on the graph when x = 1? What does this mean in terms of the snake population? (1 point)
8. The graph is of a function in the form p(t) = a • bt. What is the function? (2 points)
9. Use this function to estimate the boa constrictor population in 2 years, 3 years, and 4 years.
t: Time in yearsP(t): Estimated snake population at time t
2
3
4
10. What pattern do you see in years 2, 3, and 4? How is the snake population changing every year? (2 points)
11. How is the snake population changing every two years? (1 point)
Making a Decision:
12. Do you think the snake population can continue to grow in this way forever? Why or why not? (2 points)

Answers: 2
Another question on Mathematics
Mathematics, 21.06.2019 14:00
The axis of symmetry for the graph of the function f(x)=1/4^2+bx +10 is x=6. what is the value of b?
Answers: 1
Mathematics, 21.06.2019 20:40
Which questions would most a reader identify the author's purpose for writing? check all that apply. what type of text is this? what type of reviews did the book receive? how many copies of the book have been sold? what is the central idea? how does this text make one feel?
Answers: 2
Mathematics, 21.06.2019 20:50
The cost of turkey is directly proportional to its weight. if a 12-pount turkey costs $27, how much does a 16-pound turkey cost? a. $33.75 b. $36.00 c. $31.00 d. $32.50
Answers: 3
You know the right answer?
Questions
Mathematics, 08.07.2019 19:30
Mathematics, 08.07.2019 19:30

Mathematics, 08.07.2019 19:30

Computers and Technology, 08.07.2019 19:30

Mathematics, 08.07.2019 19:30
English, 08.07.2019 19:30
English, 08.07.2019 19:30

History, 08.07.2019 19:30
Mathematics, 08.07.2019 19:30
History, 08.07.2019 19:30
English, 08.07.2019 19:30
Mathematics, 08.07.2019 19:30
Mathematics, 08.07.2019 19:30
History, 08.07.2019 19:30


