
Mathematics, 20.12.2020 22:00 jayp02
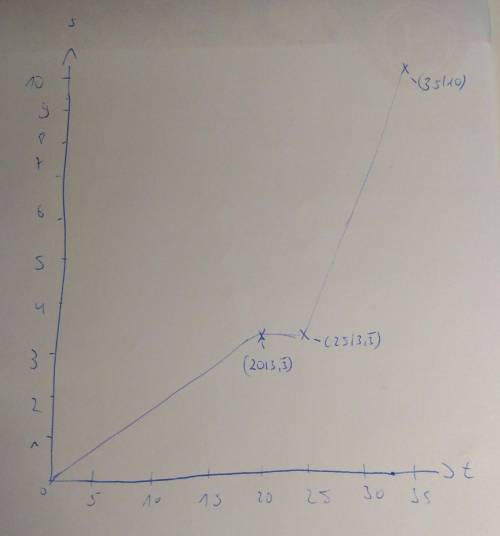
 Please create a graph to reflect the following situation:
Max is going to school. For the first 20 minutes he walks at a constant speed of 10 miles per hour. Then he gets to the bus stop and waits for the bus for another 5 minutes. Then he rides the bus for 10 minutes. The speed of the bus is 40 miles per hour.
Show graphically the distance Max has traveled to school over time since he has left his house.
Make sure you include the name of the graph, the labels and the scale on x- and y-axes; Please use graphing paper, pencil and a ruler. Please help me it’s due today I would love the help.

Answers: 3
Another question on Mathematics
Mathematics, 21.06.2019 18:30
Find the exact value of each of the following. in each case, show your work and explain the steps you take to find the value. (a) sin 17π/6 (b) tan 13π/4 (c) sec 11π/3
Answers: 2
Mathematics, 21.06.2019 20:30
Awasher and a dryer cost $701 combined. the washer costs $51 more than the dryer. what is the cost of the dryer?
Answers: 1
Mathematics, 21.06.2019 21:30
Consider the following equation. 1/2x^3+x-7=-3sqrtx-1 approximate the solution to the equation using three iterations of successive approximation. use the graph below as a starting point. a. b. c. d.
Answers: 3
You know the right answer?
 Please create a graph to reflect the following situation:
Max is going to school. For the first 2...
Questions


English, 29.03.2021 14:00
Mathematics, 29.03.2021 14:00
Mathematics, 29.03.2021 14:00

Chemistry, 29.03.2021 14:00
Mathematics, 29.03.2021 14:00

Arts, 29.03.2021 14:00
English, 29.03.2021 14:00
Mathematics, 29.03.2021 14:00
English, 29.03.2021 14:00
English, 29.03.2021 14:00
English, 29.03.2021 14:00
English, 29.03.2021 14:00
English, 29.03.2021 14:00
History, 29.03.2021 14:00


