
Mathematics, 10.12.2020 18:30 kedan12
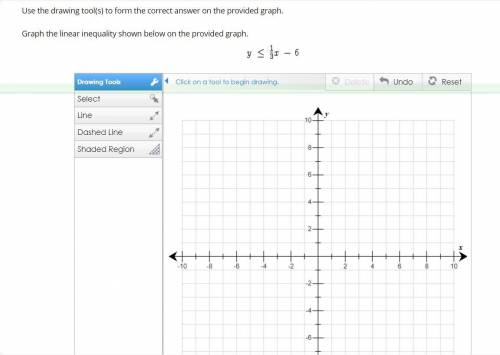
Use the drawing tool(s) to form the correct answer on the provided graph. Graph the linear inequality shown below on the provided graph.

Answers: 3
Another question on Mathematics
Mathematics, 21.06.2019 18:30
For this option, you will work individually. the pythagorean theorem can be used in many real-world scenarios. part 1 write your own real-world scenario where the pythagorean theorem can be applied to find a missing piece. you may choose to write a problem that is two- or three-dimensional in nature. be sure that you will be able to draw a diagram of your scenario. write out your problem and submit it for part 1. be sure to end your scenario with a question. part 2 draw a diagram of the scenario you created in part 1. you may draw by hand and scan and upload your drawing or create a computer-generated drawing for submission. be sure to label all parts and dimensions of the drawing. part 3 solve the question that you posed in part 1. show all of your steps in answering the question. for this option, you will need to submit all three parts for full credit—your real-world problem and question, the diagram that you created, and your work solving the problem, showing all steps. * note that your instructor is looking for your own original idea. while it is acceptable to use the internet for research and inspiration, academic integrity policies apply.
Answers: 1
Mathematics, 21.06.2019 19:00
Aflower has 26 chromosomes. to create a new flower, how many chromosomes would a sperm cell have? what is this process called? part 2: within a flower cell that has 26 chromosomes, how many chromosomes would a cell that is created within the stem of a flower as it grows, have? what is this process called?
Answers: 1
Mathematics, 21.06.2019 20:00
Mat bought a phone for $100. he has to pay $30 per mouth. if he has paid $640 in total, how many mouth has he had the phone?
Answers: 2
Mathematics, 21.06.2019 21:30
Name and describe the three most important measures of central tendency. choose the correct answer below. a. the mean, sample size, and mode are the most important measures of central tendency. the mean of a data set is the sum of the observations divided by the middle value in its ordered list. the sample size of a data set is the number of observations. the mode of a data set is its highest value in its ordered list. b. the sample size, median, and mode are the most important measures of central tendency. the sample size of a data set is the difference between the highest value and lowest value in its ordered list. the median of a data set is its most frequently occurring value. the mode of a data set is sum of the observations divided by the number of observations. c. the mean, median, and mode are the most important measures of central tendency. the mean of a data set is the product of the observations divided by the number of observations. the median of a data set is the lowest value in its ordered list. the mode of a data set is its least frequently occurring value. d. the mean, median, and mode are the most important measures of central tendency. the mean of a data set is its arithmetic average. the median of a data set is the middle value in its ordered list. the mode of a data set is its most frequently occurring value.
Answers: 3
You know the right answer?
Use the drawing tool(s) to form the correct answer on the provided graph.
Graph the linear inequali...
Questions
Mathematics, 08.09.2021 18:40

English, 08.09.2021 18:40


Computers and Technology, 08.09.2021 18:40

Mathematics, 08.09.2021 18:40


History, 08.09.2021 18:40


