
Mathematics, 08.12.2020 20:10 blakesmith0110
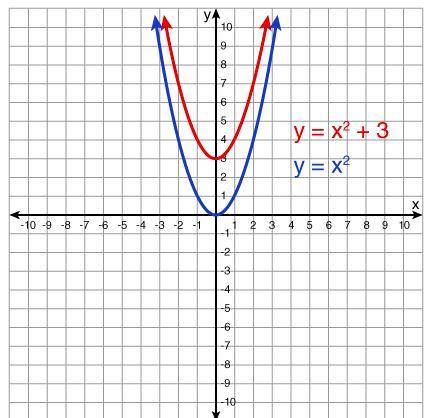
A quadratic function models the graph of a parabola. The quadratic functions, y = x2 and y = x2 + 3, are modeled in the graphs of the parabolas shown below.
Determine which situations best represent the scenario shown in the graph of the quadratic functions, y = x2 and y = x2 + 3. Select all that apply.
From x = -2 to x = 0, the average rate of change for both functions is negative
For the quadratic function, y = x^2, the coordinate (2, 3) is a solution to the equation of the function.
The quadratic function, y = x^2 + 3, has an x-intercept at the origin
The quadratic function, y = x^2, has an x-intercept at the origin
From x = -2 to x = 0, the average rate of change for both functions is positive
For the quadratic function, y = x^2 + 3, the coordinate (2, 7) is a solution to the equation of the function.

Answers: 2
Another question on Mathematics
Mathematics, 21.06.2019 17:00
You are a clerk at convenience store. a customer owes 11.69 for a bag of potatoes chips. she gives you a five dollar bill. how much change should the customer receive?
Answers: 2
Mathematics, 21.06.2019 18:50
Jermaine has t subway tokens. karen has 4 more subway tokens than jermaine. raul has 5 fewer subway tokens than jermaine. which expression represents the ratio of karen's tokens to raul's tokens
Answers: 1
Mathematics, 21.06.2019 20:40
David estimated he had about 20 fish in his pond. a year later, there were about 1.5 times as many fish. the year after that, the number of fish increased by a factor of 1.5 again. the number of fish is modeled by f(x)=20(1.5)^x. create a question you could ask that could be answered only by graphing or using a logarithm.
Answers: 1
You know the right answer?
A quadratic function models the graph of a parabola. The quadratic functions, y = x2 and y = x2 + 3,...
Questions


Biology, 15.04.2020 17:23


Mathematics, 15.04.2020 17:23
English, 15.04.2020 17:23
Mathematics, 15.04.2020 17:23
History, 15.04.2020 17:23


