1
Which graph shows a line of best fit for the scatter plot?
A
Time Watching TV vs. Gra...

Mathematics, 08.12.2020 02:30 goofy44
1
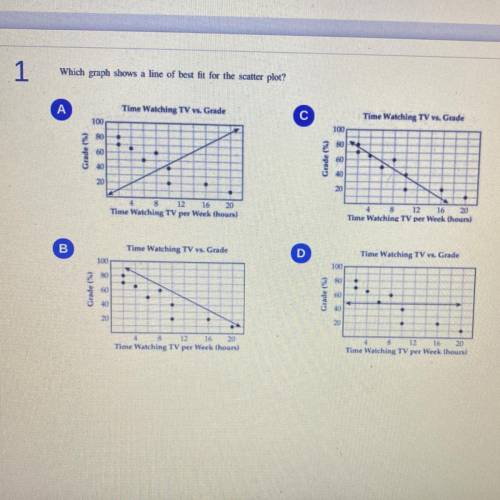
Which graph shows a line of best fit for the scatter plot?
A
Time Watching TV vs. Grade
с
Time Watching TV w. Grade
100
100
80
280
Grade ()
60
Grade (4)
60
40
40
20
20
12
4 8 12 16 20
Time Watching TV per week thours)
16 20
Time Watching TV per week hours)
B
Time Watching TV vs. Grade
D
Time Watching TV vs. Grade
100
100
Grade (6)
60
20
4
12 16 20
Time Watching TV per Week hours)
+
12 16 20
Time Watching TV per week thours)

Answers: 3
Another question on Mathematics
Mathematics, 21.06.2019 15:30
What is the missing reason in step 5? linear pair postulategivendefinition of complementary anglescongruent complements theorem
Answers: 1
Mathematics, 21.06.2019 17:00
The table shows the webster family’s monthly expenses for the first three months of the year. they are $2,687.44, $2,613.09, and $2,808.64. what is the average monthly expenditure for all expenses?
Answers: 1
Mathematics, 21.06.2019 19:00
What is the percentile for data value 6 in the following data set? 4 13 8 6 4 4 13 6 4 13 2 13 15 5 9 4 12 8 6 13 40 25 35 62
Answers: 2
You know the right answer?
Questions
Mathematics, 09.02.2021 02:30

Advanced Placement (AP), 09.02.2021 02:30

Mathematics, 09.02.2021 02:30
Mathematics, 09.02.2021 02:30


Mathematics, 09.02.2021 02:30

Spanish, 09.02.2021 02:30


Computers and Technology, 09.02.2021 02:30
Mathematics, 09.02.2021 02:30
Mathematics, 09.02.2021 02:30


