
Mathematics, 07.12.2020 21:10 dustinquiz255
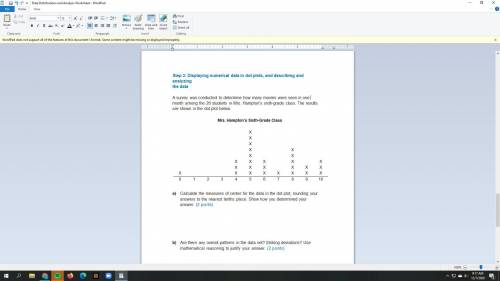
A survey was conducted to determine how many movies were seen in one month among the 26 students in Mrs. Hampton’s sixth-grade class. The results are shown in the dot plot below.
a) Calculate the measures of center for the data in the dot plot, rounding your answers to the nearest tenths place. Show how you determined your answer. (2 points)
b) Are there any overall patterns in the data set? Striking deviations? Use mathematical reasoning to justify your answer. (2 points)
c) Calculate the measures of spread for Mrs. Hampton’s class data. Justify your response by describing the process used to find each measure. (2 points)
d) Which is a better measure of spread: range or interquartile range? Why? (2 points)
e) What does the value of the mean absolute deviation tell you about the spread of the data? (2 points)

Answers: 3
Another question on Mathematics
Mathematics, 21.06.2019 18:00
Use the data on the dot plot to answer the question.how many people read for more than three hours last week? i'm on a unit test review
Answers: 1
Mathematics, 21.06.2019 20:00
You have 138.72 in your saving account u take out 45.23 and 18.00 you deposit 75.85 into your account
Answers: 1
Mathematics, 22.06.2019 00:20
Abag contains pieces of paper numbered from 5 to 9. a piece of paper is drawn at random. what is the theoretical probability of drawing a number less than 8?
Answers: 1
Mathematics, 22.06.2019 01:00
Suppose your sat score is 2040. a college with an average sat score for admintted students of which of these would most likely be your best option?
Answers: 1
You know the right answer?
A survey was conducted to determine how many movies were seen in one month among the 26 students in...
Questions

English, 30.12.2021 08:20

Chemistry, 30.12.2021 08:20

Social Studies, 30.12.2021 08:20
Mathematics, 30.12.2021 08:20

SAT, 30.12.2021 08:30
English, 30.12.2021 08:30
SAT, 30.12.2021 08:30
Engineering, 30.12.2021 08:30

Mathematics, 30.12.2021 08:30


