
Mathematics, 04.12.2020 20:50 kamgurunlian
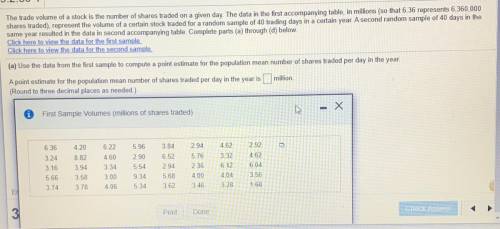
The trade volume of a stock is the number of shares traded on a given day. The data in the first accompanying table, in millions (so that 6.36 represents 6,360,000
shares traded), represent the volume of a certain stock traded for a random sample of 40 trading days in a certain year. A second random sample of 40 days in the
same year resulted in the data in second accompanying table. Complete parts (a) through (d) below.
Click here to view the data for the first sample.
Click here to view the data for the second sample.
(a) Use the data from the first sample to compute a point estimate for the population mean number of shares traded per day in the year.
A point estimate for the population mean number of shares traded per day in the year is million.
(Round to three decimal places as needed)
First Sample Volumes (millions of shares traded)
- X
0
3.84
6.52
6.36
3.24
3.16
5.66
3.74
4.20
8.82
3.94
3.58
3.78
6.22
4.60
3.34
3.00
4.06
5.96
2.90
5.54
9.34
5.34
2.94
2.94
5.76
2.36
4.00
3.46
4.62
3.32
6.12
4.04
3.28
2.92
4.62
6.04
3.56
1.68
5.68
3.62
Enter your answer in
3 parts
Print
Done
heck Answer
remaining

Answers: 2
Another question on Mathematics
Mathematics, 21.06.2019 14:30
Ahigh definition tv cost $800 with a down payment of 2/5 of the cost. how much is left to pay, in dollars after the down payment has been made?
Answers: 1
Mathematics, 21.06.2019 14:40
Consider the table below. x y -1 -5 0 5 1 11 2 13 3 11 complete the standard form equation representing the quadratic relationship displayed above, where a, b, and c are constants.
Answers: 2
Mathematics, 21.06.2019 16:50
Which is a true statement comparing the graphs of x^2/6^2-y^2/8^2 = 1 and x^2/8^2-y^2/6^2 the foci of both graphs are the same points. the lengths of both transverse axes are the same. the directrices of = 1 are horizontal while the directrices of = 1 are vertical. the vertices of = 1 are on the y-axis while the vertices of = 1 are on the x-axis.
Answers: 2
You know the right answer?
The trade volume of a stock is the number of shares traded on a given day. The data in the first acc...
Questions

Social Studies, 18.10.2019 15:10

Health, 18.10.2019 15:10
Social Studies, 18.10.2019 15:10

Mathematics, 18.10.2019 15:10

History, 18.10.2019 15:10

English, 18.10.2019 15:10

Mathematics, 18.10.2019 15:10
History, 18.10.2019 15:10
Mathematics, 18.10.2019 15:10
Mathematics, 18.10.2019 15:10


Geography, 18.10.2019 15:10

Computers and Technology, 18.10.2019 15:10
Mathematics, 18.10.2019 15:10


