
Mathematics, 02.12.2020 19:50 yeehaw777
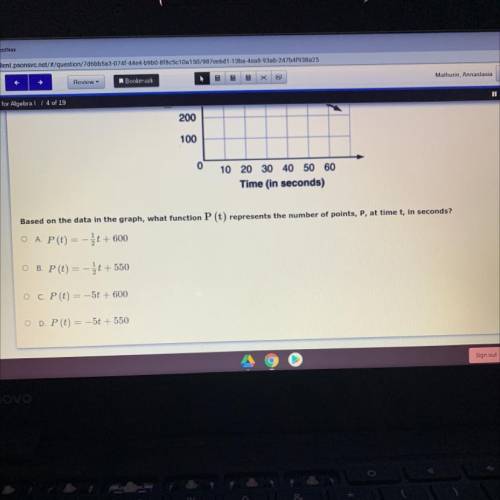
Wendy is playing a racing game. This graph shows the relationship between the time it takes Wendy to finish a race and the number of
points she earns.
Racing Game Points
600
500
400
Points
300
200
100
0
10 20 30 40 50 60
Time (in seconds)
Based on the data in the graph, what function P (t) represents the number of points, P, at time t, in seconds?

Answers: 2
Another question on Mathematics
Mathematics, 21.06.2019 13:30
What is the vertical asymptotes of the function f(x)=x-2/x*2-3x-4
Answers: 1
Mathematics, 21.06.2019 15:00
Listed in the table is the percentage of students who chose each kind of juice at lunchtime. use the table to determine the measure of the central angle you would draw to represent orange juice in a circle graph
Answers: 3
Mathematics, 21.06.2019 17:50
Which of these triangle pairs can be mapped to each other using two reflections?
Answers: 1
Mathematics, 21.06.2019 18:00
Express in the simplest form: (x^2+9x+14/x^2-49) / (3x+6/x^2+x-56)
Answers: 3
You know the right answer?
Wendy is playing a racing game. This graph shows the relationship between the time it takes Wendy to...
Questions


English, 21.01.2021 22:10

Chemistry, 21.01.2021 22:10


