
Mathematics, 01.12.2020 17:00 bhaddieraven
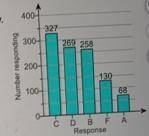
The number of responses to a survey are shown in the Pareto chart. The survey asked 1052 adults how they would grade the quality of their public schools. Each person gave one response,
Find each probability
(a) Randomly selecting a person from the sample who did not give the public schools an A
(1) Randomly selecting a person from the sample who gave the public schools a grade better than a D
(c) Randomly selecting a person from the sample who gave the public schools a Dor an F
(d) Randomly selecting a person from the sample who gave the public schools an A or B
(a) The probability that a randomly selected person did not give the public schools an Als
(Round to three decimal places as needed)

Answers: 2


Another question on Mathematics
Mathematics, 21.06.2019 18:30
Complex numbers multiply √-4 * √-25 and show all intermediate steps. alternative notation is sqrt(-4) * sqrt(-25).
Answers: 1
Mathematics, 21.06.2019 23:00
Janie has $3. she earns $1.20 for each chore she does and can do fractions of chores. she wants to earn enough money to buy a cd for $13.50.
Answers: 1
Mathematics, 22.06.2019 01:00
Def rotates 90 clockwise about point a to create d’ e’ f’. therefore, which equation must be true ?
Answers: 2
Mathematics, 22.06.2019 04:20
When booking personal travel by air, one is always interested in actually arriving at one’s final destination even if that arrival is a bit late. the key variables we can typically try to control are the number of flight connections we have to make in route, and the amount of layover time we allow in those airports whenever we must make a connection. the key variables we have less control over are whether any particular flight will arrive at its destination late and, if late, how many minutes late it will be. for this assignment, the following necessarily-simplified assumptions describe our system of interest: the number of connections in route is a random variable with a poisson distribution, with an expected value of 1. the number of minutes of layover time allowed for each connection is based on a random variable with a poisson distribution (expected value 2) such that the allowed layover time is 15*(x+1). the probability that any particular flight segment will arrive late is a binomial distribution, with the probability of being late of 50%. if a flight arrives late, the number of minutes it is late is based on a random variable with an exponential distribution (lamda = .45) such that the minutes late (always rounded up to 10-minute values) is 10*(x+1). what is the probability of arriving at one’s final destination without having missed a connection? use excel.
Answers: 3
You know the right answer?
The number of responses to a survey are shown in the Pareto chart. The survey asked 1052 adults how...
Questions


Biology, 24.09.2020 14:01
Mathematics, 24.09.2020 14:01
Mathematics, 24.09.2020 14:01


History, 24.09.2020 14:01
Mathematics, 24.09.2020 14:01
Mathematics, 24.09.2020 14:01
Mathematics, 24.09.2020 14:01
Mathematics, 24.09.2020 14:01
Mathematics, 24.09.2020 14:01
Mathematics, 24.09.2020 14:01
Mathematics, 24.09.2020 14:01


