
Mathematics, 01.12.2020 08:20 Meliiiii
Plz help with this question im so confused i dont understand.
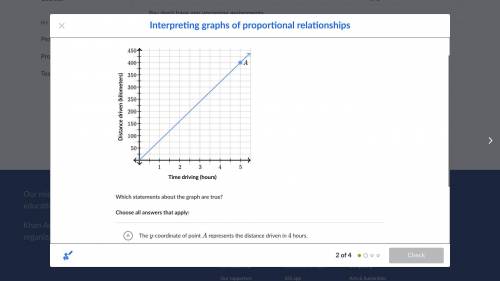
The proportional relationship between the distance driven and the amount of time driving is shown in the following graph.
Which statements about the graph are true?
Choose all answers that apply:
A. The y-coordinate of point AAA represents the distance driven in 444 hours.
B. The distance driven in 1 hour is 80km.
C. None of the above

Answers: 2
Another question on Mathematics
Mathematics, 21.06.2019 20:00
In new york city at the spring equinox there are 12 hours 8 minutes of daylight. the longest and shortest days of the year very by two hours and 53 minutes from the equinox in this year the equinox falls on march 21 in this task you use trigonometric function to model the hours of daylight hours on certain days of the year in new york city a.what is the independent and dependent variables? b.find the amplitude and the period of the function. c.create a trigonometric function that describes the hours of sunlight for each day of the year. d. graph the function you build in part c. e. use the function you build in part c to find out how many fewer daylight hours february 10 will have than march 21. you may look at the calendar.
Answers: 1
Mathematics, 21.06.2019 22:30
Meghan has created a diagram of her city with her house, school, store, and gym identified. a. how far is it from the gym to the store? b. meghan also wants to walk to get some exercise, rather than going to the gym. she decides to walk along arc ab. how far will she walk? round to 3 decimal places.
Answers: 1
Mathematics, 22.06.2019 01:30
Have you ever been in the middle of telling a story and had to use hand gestures or even a drawing to make your point? in algebra, if we want to illustrate or visualize a key feature of a function, sometimes we have to write the function in a different form—such as a table, graph, or equation—to determine the specific key feature we’re looking for. think about interactions with others and situations you’ve come across in your own life. how have you had to adjust or change the way you represented something based on either the concept you were trying to describe or the person you were interacting with? explain how the complexity or layout of the concept required you to change your style or presentation, or how the person’s unique learning style affected the way you presented the information.
Answers: 1
Mathematics, 22.06.2019 02:30
Which problem would you use the following proportion to solve for? 24/x=40/100 a. what is 40% of 24? b. what percent is 24 of 40? c. twenty-four is 40% of what number? d. forty percent of 24 is what number?
Answers: 3
You know the right answer?
Plz help with this question im so confused i dont understand.
The proportional relationship between...
Questions


Computers and Technology, 08.07.2021 16:30
Mathematics, 08.07.2021 16:30


Biology, 08.07.2021 16:30

Mathematics, 08.07.2021 16:30
Computers and Technology, 08.07.2021 16:30
Mathematics, 08.07.2021 16:30
Computers and Technology, 08.07.2021 16:40
Mathematics, 08.07.2021 16:40
Computers and Technology, 08.07.2021 16:40
English, 08.07.2021 16:40


