
Mathematics, 30.11.2020 20:50 estherboocx
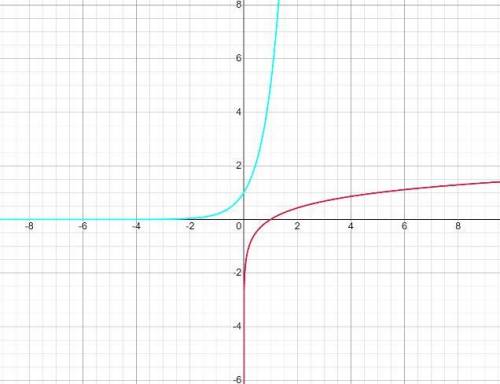
Graph y = 5ˣ and y = log₅x on a sheet of paper using the same set of axes. Use the graph to describe the domain and range of each function. Then identify the y-intercept of each function and any asymptotes of each function. I've already done the graphing, I just need help with the rest of it :)

Answers: 3
Another question on Mathematics
Mathematics, 21.06.2019 20:30
Daryl factors the polynomial p(x)=x3+x2−26x+24 to rewrite it as p(x)=(x+6)(x−4)(x−1). which equations must be true? there may be more than one correct answer. select all correct answers. p(1)=0 p(−4)=0 p(−1)=0 p(6)=0 p(4)=0 p(−6)=0
Answers: 1
Mathematics, 21.06.2019 23:00
Which of the following scenarios demonstrates an exponential decay
Answers: 1
Mathematics, 21.06.2019 23:30
What are the measures of angles a, b, and c? show your work and explain your answers. 25 points
Answers: 1
Mathematics, 22.06.2019 00:00
The amount of data left on the cell phone six gb for 81.5 gb of data is used how much data is available at the beginning of the cycle
Answers: 2
You know the right answer?
Graph y = 5ˣ and y = log₅x on a sheet of paper using the same set of axes. Use the graph to describe...
Questions


History, 12.02.2020 03:52


Mathematics, 12.02.2020 03:52

Mathematics, 12.02.2020 03:52


French, 12.02.2020 03:52


