Part A
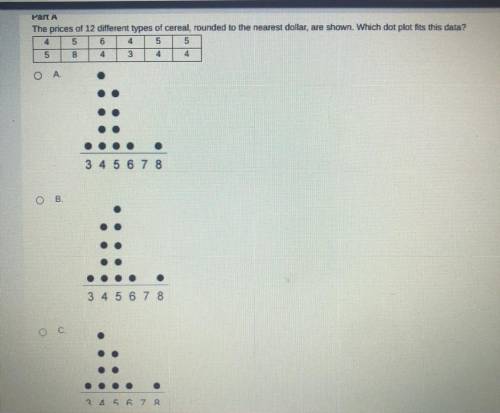
The prices of 12 different types of cereal rounds to the near test dollar are shown. Wh...

Mathematics, 30.11.2020 18:50 giselabarajas24
Part A
The prices of 12 different types of cereal rounds to the near test dollar are shown. Which dot plot fits this data?
A.
B.
C.
Part B
Cereal Brand X costs $3. Use the data from Part A. Which description of Brand X is most accurate?
A. Brand X costs more than the median price of the cereals in the plot.
B. Brand X is an outlier for the data set.
C. The price of Brand C is the same as the price that was recorded most often.
Brand X costs about a dollar less than the price that was recorded most often.

Answers: 2
Another question on Mathematics
Mathematics, 21.06.2019 14:30
Find the value of tan theta if sin theta = 12/13 and theta is in quadrant 2
Answers: 3
Mathematics, 21.06.2019 19:00
When keisha installed a fence along the 200 foot perimeter of her rectangular back yard, she left an opening for a gate.in the diagram below, she used x to represent the length in feet of the gate? what is the value? a. 10 b. 20 c. 25 d. 30
Answers: 1
Mathematics, 21.06.2019 20:30
Solve each quadratic equation by factoring and using the zero product property. x^2 - 8x + 30 = 3x
Answers: 2
You know the right answer?
Questions


Computers and Technology, 02.08.2019 19:30

Social Studies, 02.08.2019 19:30


Mathematics, 02.08.2019 19:30

Computers and Technology, 02.08.2019 19:30
Mathematics, 02.08.2019 19:30


