
Mathematics, 13.11.2020 20:10 kayeeii
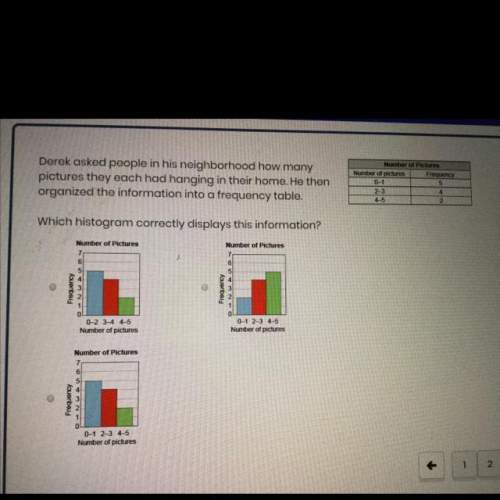
A store manager wishes to investigate whether there is a relationship between the type of promotion offered and the
number of customers who spend more than $30 on a purchase. Data will be gathered and placed into the two-way
table below.
Customer Spending by Promotion Run
Customers
Spending
More than $30
Customers
Spending
$30 or Less
$10 off $50
15% off
$5 off $25
Buy-1-Get-1 Half Off
Which statement best describes how the manager can check if there is an association between the two variables?
ОО
The manager must check relative frequencies by row because there are more than two different promotions.
The manager must check relative frequencies by column because there are more than two different promotions.

Answers: 2
Another question on Mathematics
Mathematics, 21.06.2019 20:00
Michelle and julie work at a catering company. they need to bake 264 cookies for a birthday party that starts in a little over an hour and a half. each tube of cookie dough claims to make 36 cookies, but michelle eats about 1/5 of every tube and julie makes cookies that are 1.5 times as large as the recommended cookie size.it takes about 8 minutes to bake a container of cookies, but since julie's cookies are larger, they take 12 minutes to bake. a. how many tubes should each girl plan to bake? how long does each girl use the oven? b. explain your solution process what did you make? c. what assumptions did you make?
Answers: 2
Mathematics, 22.06.2019 01:00
Ataxi company charges $3 for pick-up plus $0.65 for each mile. select the expressions that represent the cost in dollars for a taxi pick-up and m miles. mark all that apply.
Answers: 1
Mathematics, 22.06.2019 02:00
1. the manager of collins import autos believes the number of cars sold in a day (q) depends on two factors: (1) the number of hours the dealership is open (h) and (2) the number of salespersons working that day (s). after collecting data for two months (53 days), the manager estimates the following log-linear model: q 4 equation 1 a. explain, how to transform the log-linear model into linear form that can be estimated using multiple regression analysis. the computer output for the multiple regression analysis is shown below: q4 table b. how do you interpret coefficients b and c? if the dealership increases the number of salespersons by 20%, what will be the percentage increase in daily sales? c. test the overall model for statistical significance at the 5% significance level. d. what percent of the total variation in daily auto sales is explained by this equation? what could you suggest to increase this percentage? e. test the intercept for statistical significance at the 5% level of significance. if h and s both equal 0, are sales expected to be 0? explain why or why not? f. test the estimated coefficient b for statistical significance. if the dealership decreases its hours of operation by 10%, what is the expected impact on daily sales?
Answers: 2
You know the right answer?
A store manager wishes to investigate whether there is a relationship between the type of promotion...
Questions

Chemistry, 17.04.2020 01:55


Biology, 17.04.2020 01:56
Mathematics, 17.04.2020 01:56
History, 17.04.2020 01:56


Mathematics, 17.04.2020 01:56
History, 17.04.2020 01:56


