
Mathematics, 10.11.2020 20:30 amir6658
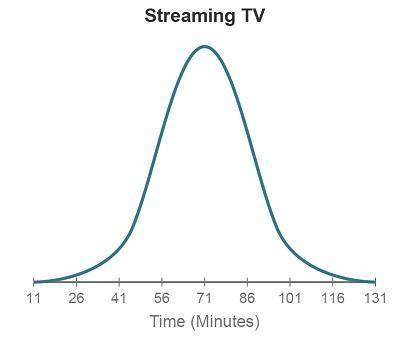
The graph shows the distribution of the amount of time (in minutes) people spend watching TV shows on a popular streaming service. The distribution is approximately Normal, with a mean of 71 minutes and a standard deviation of 15 minutes.
A graph titled Streaming T V has time (minutes) on the x-axis, going from 11 to 131 in increments of 15. The highest point of the curve is at 71.
What percentage of people spend more than 116 minutes watching TV shows on this streaming service?
0.15%
2.5%
16%
99.85%

Answers: 1
Another question on Mathematics
Mathematics, 21.06.2019 19:30
Lin is writing an equation to model the proportional relationship between y, the total cost in dollars of downloading videos from a website, and x, the number of videos downloaded. she knows that the total cost to download 3 videos was $12. her work to find the equation is shown below. joylin’s work step 1 k= 3/12= 0.25 step 2 y= 0.25x where did joylin make her first error?
Answers: 2
Mathematics, 21.06.2019 22:00
Consider the triangle. which shows the order of the angles from smallest to largest? angle a, angle b, angle c angle b, angle a, angle c angle b, angle c, angle a angle c, angle a, angle b
Answers: 3
Mathematics, 22.06.2019 01:00
What are the solutions for the following system? -2x^2+y=-5 y=-3x^2+5
Answers: 3
You know the right answer?
The graph shows the distribution of the amount of time (in minutes) people spend watching TV shows o...
Questions
Mathematics, 28.01.2021 18:10
Mathematics, 28.01.2021 18:10


History, 28.01.2021 18:10

Mathematics, 28.01.2021 18:10
Mathematics, 28.01.2021 18:10
Mathematics, 28.01.2021 18:10
Biology, 28.01.2021 18:10

Mathematics, 28.01.2021 18:10
Mathematics, 28.01.2021 18:10

Computers and Technology, 28.01.2021 18:10
Mathematics, 28.01.2021 18:10
English, 28.01.2021 18:10

Advanced Placement (AP), 28.01.2021 18:10


