
Mathematics, 06.11.2020 18:50 juandguardado7045
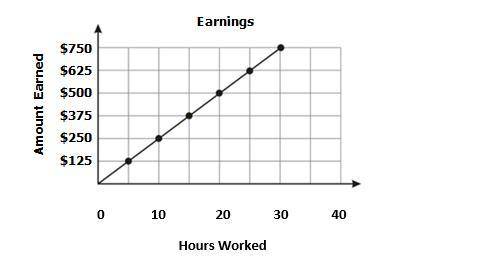
The graph represents the amount a waiter earns over time.
According to the graph, what is the constant of proportionality?
A. The waiter earns $25 an hour.
B. The waiter earns $20 an hour.
C. The waiter earns $15 an hour.
D. The waiter earns $10 an hour.

Answers: 1
Another question on Mathematics
Mathematics, 21.06.2019 16:30
On average, how many more hits will he get when he bats 100 times at home during the day as opposed to 100 times away at night?
Answers: 2
Mathematics, 21.06.2019 17:30
One integer is 5 more than another. their product is 104. find the integers
Answers: 2
Mathematics, 21.06.2019 18:30
Need an artist designed a badge for a school club. figure abcd on the coordinate grid below shows the shape of the badge: the badge is enlarged and plotted on the coordinate grid as figure jklm with point j located at (2, -2) and point m is located at (5, 4). which of these could be the coordinates for point l? a. (2, 4) b. (8, 4) c. (5, 1) d. (5, 7)
Answers: 2
Mathematics, 21.06.2019 19:00
You give a $4 tip for a meal that cost $22. approximately what percent of the bill was your tip?
Answers: 1
You know the right answer?
The graph represents the amount a waiter earns over time.
According to the graph, what is the const...
Questions
Mathematics, 24.06.2019 16:00


History, 24.06.2019 16:00

Computers and Technology, 24.06.2019 16:00
History, 24.06.2019 16:00
Mathematics, 24.06.2019 16:00
Mathematics, 24.06.2019 16:00
Mathematics, 24.06.2019 16:00

Social Studies, 24.06.2019 16:00

Biology, 24.06.2019 16:00


