PLEASE HELP AND ANSWER BY TOMORROW
Social Sharing
Three Algebra 1 students are comparing how...

Mathematics, 05.11.2020 18:50 roxannaemigdio3850
PLEASE HELP AND ANSWER BY TOMORROW
Social Sharing
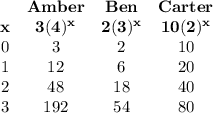
Three Algebra 1 students are comparing how fast their social media posts have spread. Their results are shown in the following table.
Student Amber Ben Carter
Description Amber shared her photo with 3 people. They continued to share it, so the number of shares increases every day as shown by the function.
Ben shared his post with 2 friends. Each of those friends shares with 3 more every day, so the number of shares triples every day.
Carter shared his post with 10 friends, who each share with only 2 people each day.
Social Media Post Shares f(x) = 3(4)x
Day Number of Shares
0 2
1 6
2 18
Carter shared his post with 10 friends, who each share with only 2 people each day.
Write an exponential function to represent the spread of Ben's social media post.
Write an exponential function to represent the spread of Carter's social media post.
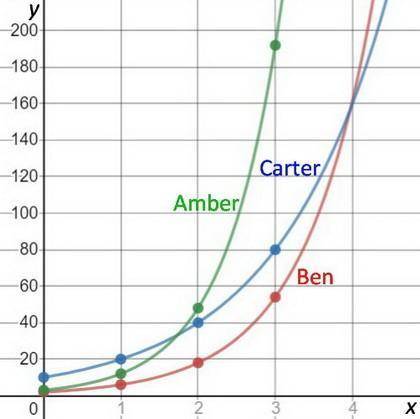
Graph each function using at least three points for each curve. All graphs should be placed together on the same coordinate plane, so be sure to label each curve. You may graph your equation by hand on a piece of paper and scan your work or you may use graphing technology.
Using the functions for each student, predict how many shares each student's post will be received on Day 3 and then on Day 10. Justify your answers.
If Amber decides to mail copies of her photo to the 45 residents of her grandmother's assisted living facility, the new function representing her photo shares is f(x) = 3(4)x + 45. How does this graph compare with the original graph of Amber's photo share?
Based on your results, which students' post travels the fastest? How is this shown in the equation form of the functions?
If you had to choose, would you prefer a post with fewer friends initially but more shares, like Amber, or more friends initially but fewer shares? Justify your answer with your calculations from previous questions.

Answers: 3
Another question on Mathematics
Mathematics, 21.06.2019 16:00
Part one: measurements 1. measure your own height and arm span (from finger-tip to finger-tip) in inches. you will likely need some from a parent, guardian, or sibling to get accurate measurements. record your measurements on the "data record" document. use the "data record" to you complete part two of this project. name relationship to student x height in inches y arm span in inches archie dad 72 72 ginelle mom 65 66 sarah sister 64 65 meleah sister 66 3/4 67 rachel sister 53 1/2 53 emily auntie 66 1/2 66 hannah myself 66 1/2 69 part two: representation of data with plots 1. using graphing software of your choice, create a scatter plot of your data. predict the line of best fit, and sketch it on your graph. part three: the line of best fit include your scatter plot and the answers to the following questions in your word processing document 1. 1. which variable did you plot on the x-axis, and which variable did you plot on the y-axis? explain why you assigned the variables in that way. 2. write the equation of the line of best fit using the slope-intercept formula $y = mx + b$. show all your work, including the points used to determine the slope and how the equation was determined. 3. what does the slope of the line represent within the context of your graph? what does the y-intercept represent? 5. use the line of best fit to you to describe the data correlation.
Answers: 2
Mathematics, 21.06.2019 17:10
Consider the functions below. function 1 function 2 function 3 select the statement which is true about the functions over the interval [1, 2] a b function 3 has the highest average rate of change function 2 and function 3 have the same average rate of change. function and function 3 have the same average rate of change function 2 has the lowest average rate of change d.
Answers: 3
Mathematics, 22.06.2019 06:30
Systems of linear equation problem. with the wind a cyclist rode 24 miles in three hours. she returned in twelve hours against the wind. find the rate of the cyclist without wind and the rate of the wind.
Answers: 3
Mathematics, 22.06.2019 07:40
Camille is preparing for her english test by typing up the notes she recorded in the margins of her 98-page workbook. she already started typing her notes, and got through the first 14 pages. if camille types for x hours at a rate of 21 pages per hour, which equation represents the number of pages she has typed, and how many hours will it take to complete the task?
Answers: 3
You know the right answer?
Questions
Mathematics, 03.03.2021 22:10


Physics, 03.03.2021 22:10

History, 03.03.2021 22:10
History, 03.03.2021 22:10

World Languages, 03.03.2021 22:10

English, 03.03.2021 22:10


