
Mathematics, 04.11.2020 07:50 alayciaruffin076
Question 4
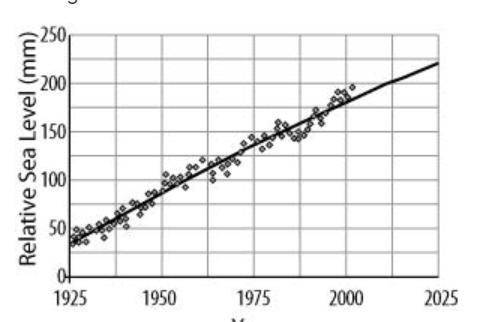
The figure shows the actual increase in sea level between the years 1925 and 2000 (shown by the points) and a mathematical model that has been fitted to the data (shown by the line).
image 5afdca68eca248c59dbe6c57ceabf51b
Based on the model in the graph, which is the best estimate of the average annual increase in sea level expected between the years 2000 and 2025?
A
1.6 mm/year
B
1.9 mm/year
C
40 mm/year
D
150 mm/year

Answers: 3
Another question on Mathematics
Mathematics, 21.06.2019 20:30
Max recorded the heights of 500 male humans. he found that the heights were normally distributed around a mean of 177 centimeters. which statements about max’s data must be true? a) the median of max’s data is 250 b) more than half of the data points max recorded were 177 centimeters. c) a data point chosen at random is as likely to be above the mean as it is to be below the mean. d) every height within three standard deviations of the mean is equally likely to be chosen if a data point is selected at random.
Answers: 2
Mathematics, 21.06.2019 20:30
Write an equation of the line that passes through 9,2 and is parallel to the line y=5/3x+9
Answers: 1
Mathematics, 21.06.2019 21:00
Isabel graphed the following system of equations. 2x – y = 6 y = -3x + 4 she came up with the solution (2,-2). what were the 3 steps she did to get that solution? (make sure they are in the correct order)
Answers: 2
You know the right answer?
Question 4
The figure shows the actual increase in sea level between the years 1925 and 2000 (shown...
Questions

Mathematics, 12.04.2020 22:01
Mathematics, 12.04.2020 22:02
English, 12.04.2020 22:02
Mathematics, 12.04.2020 22:02

Physics, 12.04.2020 22:02
Mathematics, 12.04.2020 22:02

English, 12.04.2020 22:05

English, 12.04.2020 22:16
English, 12.04.2020 22:16
Mathematics, 12.04.2020 22:16

Advanced Placement (AP), 12.04.2020 22:16


