Complete Question
Find the range for the population mean value with 95% and 65% confidence intervals for each set of data.
 ,
,  ,
,  ,
,
 ,
,  ,
, 
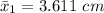
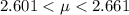
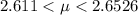
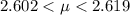
The range for the population mean value with 95% confidence intervals for the first set of data is

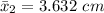
The range for the population mean value with 95% confidence intervals for the second set of data is
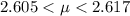
The range for the population mean value with 65% confidence intervals for the first set of data is
The range for the population mean value with 65% confidence intervals for the second set of data is
Step-by-step explanation:
Generally the range for the population mean value with 95% confidence intervals for the first set of data is mathematically evaluated as follows
Generally the degree of freedom is mathematically evaluated as

=> 
=> 
From the question we are told the confidence level is 95% , hence the level of significance is
=> 
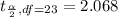
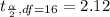
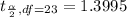
Generally from the t distribution table the critical value of at is
Generally the margin of error is mathematically represented as
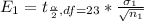
=> 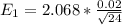
=> 
Generally 95% confidence interval is mathematically represented as


=> 
Generally the range for the population mean value with 95% confidence intervals for the second set of data is mathematically evaluated as follows
Generally the degree of freedom is mathematically evaluated as

=> 
=> 
From the question we are told the confidence level is 95% , hence the level of significance is
=>
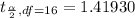
Generally from the t distribution table the critical value of at is
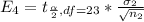
Generally the margin of error is mathematically represented as
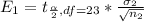
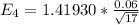
=> 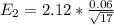
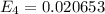
=> 
Generally 95% confidence interval is mathematically represented as


=>
Generally the range for the population mean value with 65% confidence intervals for the first set of data is mathematically evaluated as follows
Generally the degree of freedom is mathematically evaluated as
=>
=>
From the question we are told the confidence level is 95% , hence the level of significance is
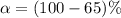
=> 
Generally from the t distribution table the critical value of at is
Generally the margin of error is mathematically represented as

=> 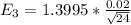
=> 
Generally 95% confidence interval is mathematically represented as


=>
Generally the range for the population mean value with 65% confidence intervals for the second set of data is mathematically evaluated as follows
Generally the degree of freedom is mathematically evaluated as
=>
=>
From the question we are told the confidence level is 95% , hence the level of significance is
=>
Generally from the t distribution table the critical value of at is
Generally the margin of error is mathematically represented as
=> 
=> 
Generally 95% confidence interval is mathematically represented as


=>


