
Mathematics, 24.10.2020 19:50 genyjoannerubiera
Use this table to answer questions below. Choose the correct answer.
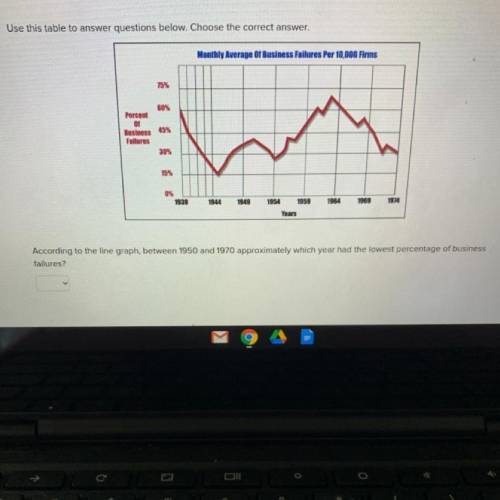
Monthly Average of Business Failures Per 10,000 Firms
75%
60%
Percent
01
Business
Failures
45%
30%
15%
0%
1939
1944
1949
1964
1969
1974
1954 1959
Years
According to the line graph, between 1950 and 1970 approximately which year had the lowest percentage of business
failures?

Answers: 1
Another question on Mathematics
Mathematics, 21.06.2019 19:30
Identify the number 127 as a rational or irrational. explain
Answers: 2
Mathematics, 21.06.2019 20:00
Does anyone know how to solve and graph this: 4 + | a + 2 | < 7the only part i don't get is the "4 +"
Answers: 2
You know the right answer?
Use this table to answer questions below. Choose the correct answer.
Monthly Average of Business Fa...
Questions

Mathematics, 01.11.2019 19:31


History, 01.11.2019 19:31

History, 01.11.2019 19:31
History, 01.11.2019 19:31
Mathematics, 01.11.2019 19:31
English, 01.11.2019 19:31
Chemistry, 01.11.2019 19:31

Advanced Placement (AP), 01.11.2019 19:31


