
Mathematics, 22.10.2020 22:01 heidibode
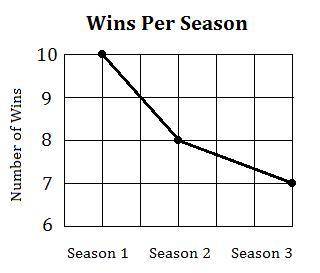
The following graph shows the number of soccer games a team won in each of their first three
seasons. Explain how you could redraw the graph so that the change in wins between the three
seasons do not seem so great
PLS EXPLAIN IN THE BEST WAY YOU CAN
I WILL GIVE 50 POINTS I U GET IT RIGHT

Answers: 1
Another question on Mathematics
Mathematics, 21.06.2019 15:40
Need ! discuss how to convert the standard form of the equation of a circle to the general form. 50 points
Answers: 1
Mathematics, 21.06.2019 16:00
The scatter plot graph shows the average annual income for a certain profession based on the number of years of experience which of the following is most likely to be the equation of the trend line for this set of data? a. i=5350e +37100 b. i=5350e-37100 c. i=5350e d. e=5350e+37100
Answers: 1
Mathematics, 21.06.2019 19:30
Lin is writing an equation to model the proportional relationship between y, the total cost in dollars of downloading videos from a website, and x, the number of videos downloaded. she knows that the total cost to download 3 videos was $12. her work to find the equation is shown below. joylin’s work step 1 k= 3/12= 0.25 step 2 y= 0.25x where did joylin make her first error?
Answers: 2
You know the right answer?
The following graph shows the number of soccer games a team won in each of their first three
season...
Questions


Computers and Technology, 01.03.2021 22:10
Mathematics, 01.03.2021 22:10


Mathematics, 01.03.2021 22:10


Mathematics, 01.03.2021 22:10


