
Mathematics, 22.10.2020 16:01 marahsenno
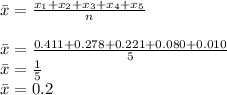
The histogram shows the distribution of hurricanes that have hit a country from 1851 through 2015, where 1 is the weakest level and 5 is the strongest level.
1= 0.411
2=0.278
3=0.221
4=0.080
5=0.010
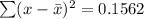
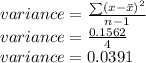
(a) Find the mean, variance and standard deviation of the probability distribution.
(b) Interpret the results: A, B, C or D.
A. The average hurricane is aprox. category 1.
B. The average hurricane is aprox. category 2.*
C. Most of the hurricane sizes differ from the average by about 2 or 3.
D. Most of the hurricane sized differ from the average by about 1 or 2.*

Answers: 3
 )
)


Another question on Mathematics
Mathematics, 21.06.2019 19:00
Which sentence uses an objective tone? we will plant the best garden of any school in the area. the new campus garden will surely be envied by other schools. a garden would provide numerous benefits to the students. you will probably agree that gardens have many benefits.
Answers: 3
Mathematics, 21.06.2019 21:20
Find the missing variable for a parallelogram: a = latex: 28in^2 28 i n 2 h = b = 6.3 in (1in=2.54cm)
Answers: 3
Mathematics, 21.06.2019 23:00
If you apply the changes below to the linear parent function f(x)=x what is the equation of the new function vertically stretched by a factor of 3 flip over the x axis
Answers: 2
You know the right answer?
The histogram shows the distribution of hurricanes that have hit a country from 1851 through 2015, w...
Questions


Computers and Technology, 13.10.2020 03:01


History, 13.10.2020 03:01

SAT, 13.10.2020 03:01

English, 13.10.2020 03:01


