
Mathematics, 21.10.2020 23:01 familyk0jj3
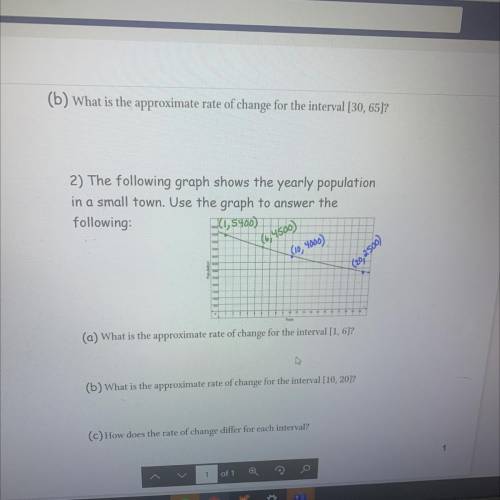
2) The following graph shows the yearly population
in a small town. Use the graph to answer the
following:
(1,5900)
14/4500)
(10,4000)
(29,2500)
(a) What is the approximate rate of change for the interval [1, 6)?
(b) What is the approximate rate of change for the interval [10, 2017
(c) How does the rate of change differ for each interval?

Answers: 2
Another question on Mathematics
Mathematics, 21.06.2019 19:30
Factor the following expression. 27y3 – 343 a. (3y + 7)(9y2 + 2ly + 49) b. (3y – 7)(9y2 + 2ly + 49) c. (3y – 7)(932 – 217 + 49) d. (3y + 7)(92 – 2ly + 49)
Answers: 1
Mathematics, 22.06.2019 02:30
Lines a and b are perpendicular. if the slope of line a is 3, what is the slope of line b?
Answers: 1
Mathematics, 22.06.2019 03:00
The sum of four times a number and three is two times the number minus twenty nine
Answers: 2
Mathematics, 22.06.2019 03:30
Find the simplified product: 2sqrt 5x^3(-3sqrt10x^2) a: -30sqrt2x^5 b: -30x^2sqrt2x c: -12x^2sqrt5x d: -6sqrt50x^5
Answers: 2
You know the right answer?
2) The following graph shows the yearly population
in a small town. Use the graph to answer the
Questions
Mathematics, 05.05.2021 19:20
Mathematics, 05.05.2021 19:20


Mathematics, 05.05.2021 19:20
Mathematics, 05.05.2021 19:20
Mathematics, 05.05.2021 19:20
Mathematics, 05.05.2021 19:20
Mathematics, 05.05.2021 19:20


Social Studies, 05.05.2021 19:20


