
Mathematics, 21.10.2020 01:01 charismameeks
AP Statistics teachers from across the country meet annually in Kansas City to score AP Statistics
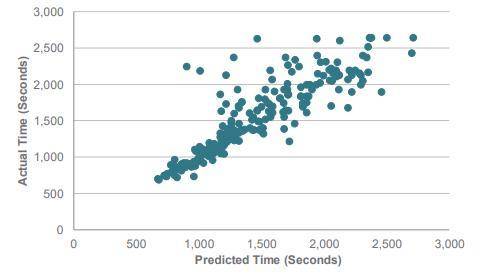
exams. One social event that many teachers participate in is the annual Prediction Fun Run. Prior to the
race, the teachers predict how long it will take them to complete the 1.96-mile long course. During the
event, they are timed and their actual finishing times are paired with their predicted times. Here is a
scatterplot of the results.
The winner of the race is not the fastest runner, but the most accurate runner.
a) Let x = the runner’s predicted time (in seconds) and y = the runner’s actual time (in seconds).
Provide the equation of the line that can be used to assess how accurate the runners were. Plot
this line on the graph above. Clearly label two points you are using to plot the line.
b) Is the line you drew in part (a) a least-squares regression line for these data? Explain.
c) While many runners were quite good at predicting their race time, some runners did very poorly at
this task. Circle the point of the runner who had the largest error in prediction. Justify your choice.
Was this runner faster or slower than predicted?
d) Describe the relationship between predicted time and actual time. Are all runners able to predict
their actual times approximately equally well?

Answers: 3
Another question on Mathematics
Mathematics, 21.06.2019 17:30
11. a particular type of cell doubles in number every hour. which function can be used to find the number of cells present at the end of h hours if there are initially 4 of these cells? a. n = 4 ()" b. n = 4(2)" c. n = 4 + (2)" din = 4 +"
Answers: 1
Mathematics, 21.06.2019 18:10
What is the equation in slope-intercept form of the linear function represented by the table? y -18 -1 -8 4 2 912 o y=-2x-6 o y=-2x+6 o y=2x-6 o y = 2x+6
Answers: 1
Mathematics, 21.06.2019 19:30
Click the arrows to advance or review slides. mapping carbohydrates to food carbohydrates (grams) 15 food (quantity) bread (1 slice) pasta (1/3 cup) apple (1 medium) mashed potatoes (1/2 cup) broccoli (1/2 cup) carrots (1/2 cup) milk (1 cup) yogurt (6 oz.) 12 12 is jennifer's relation a function? yes no f 1 of 2 → jennifer figure out the difference between a function and a relation by answering the questions about her food choices
Answers: 2
Mathematics, 21.06.2019 20:20
Recall that the owner of a local health food store recently started a new ad campaign to attract more business and wants to know if average daily sales have increased. historically average daily sales were approximately $2,700. the upper bound of the 95% range of likely sample means for this one-sided test is approximately $2,843.44. if the owner took a random sample of forty-five days and found that daily average sales were now $2,984, what can she conclude at the 95% confidence level?
Answers: 1
You know the right answer?
AP Statistics teachers from across the country meet annually in Kansas City to score AP Statistics...
Questions

Mathematics, 28.01.2020 05:31

Social Studies, 28.01.2020 05:31


Mathematics, 28.01.2020 05:31


Mathematics, 28.01.2020 05:31
Mathematics, 28.01.2020 05:31

Computers and Technology, 28.01.2020 05:31
History, 28.01.2020 05:31


