
Mathematics, 20.10.2020 22:01 codyshs160
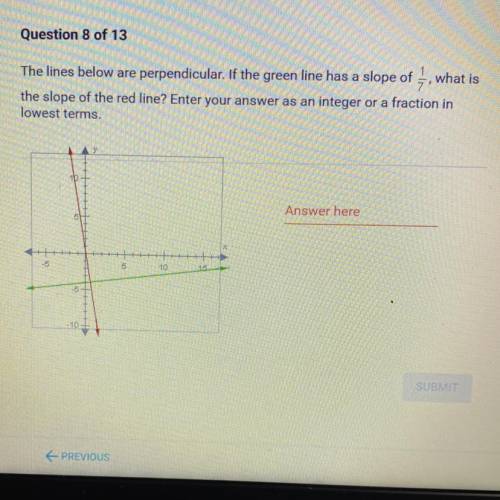
The lines below are perpendicular. If the green line has a slope of 1/7, what is
the slope of the red line?
Enter your answer as an integer or a fraction in
lowest terms.

Answers: 1
Another question on Mathematics
Mathematics, 21.06.2019 18:00
Assume that the weights of quarters are normally distributed with a mean of 5.67 g and a standard deviation 0.070 g. a vending machine will only accept coins weighing between 5.48 g and 5.82 g. what percentage of legal quarters will be rejected? round your answer to two decimal places.
Answers: 1
Mathematics, 21.06.2019 22:30
Amachine that produces a special type of transistor (a component of computers) has a 2% defective rate. the production is considered a random process where each transistor is independent of the others. (a) what is the probability that the 10th transistor produced is the first with a defect? (b) what is the probability that the machine produces no defective transistors in a batch of 100? (c) on average, how many transistors would you expect to be produced before the first with a defect? what is the standard deviation? (d) another machine that also produces transistors has a 5% defective rate where each transistor is produced independent of the others. on average how many transistors would you expect to be produced with this machine before the first with a defect? what is the standard deviation? (e) based on your answers to parts (c) and (d), how does increasing the probability of an event a↵ect the mean and standard deviation of the wait time until success?
Answers: 3
Mathematics, 22.06.2019 01:00
The weight of 46 new patients of a clinic from the year 2018 are recorded and listed below. construct a frequency distribution, using 7 classes. then, draw a histogram, a frequency polygon, and an ogive for the data, using the relative information from the frequency table for each of the graphs. describe the shape of the histogram. data set: 130 192 145 97 100 122 210 132 107 95 210 128 193 208 118 196 130 178 187 240 90 126 98 194 115 212 110 225 187 133 220 218 110 104 201 120 183 124 261 270 108 160 203 210 191 180 1) complete the frequency distribution table below (add as many rows as needed): - class limits - class boundaries - midpoint - frequency - cumulative frequency 2) histogram 3) frequency polygon 4) ogive
Answers: 1
You know the right answer?
The lines below are perpendicular. If the green line has a slope of 1/7, what is
the slope of the r...
Questions
Mathematics, 09.02.2021 21:40


Biology, 09.02.2021 21:40

English, 09.02.2021 21:40
Mathematics, 09.02.2021 21:40

Arts, 09.02.2021 21:40

Chemistry, 09.02.2021 21:40
Mathematics, 09.02.2021 21:40
Mathematics, 09.02.2021 21:40
Mathematics, 09.02.2021 21:40
Mathematics, 09.02.2021 21:40

French, 09.02.2021 21:40


