
Mathematics, 20.10.2020 21:01 andrewmena05
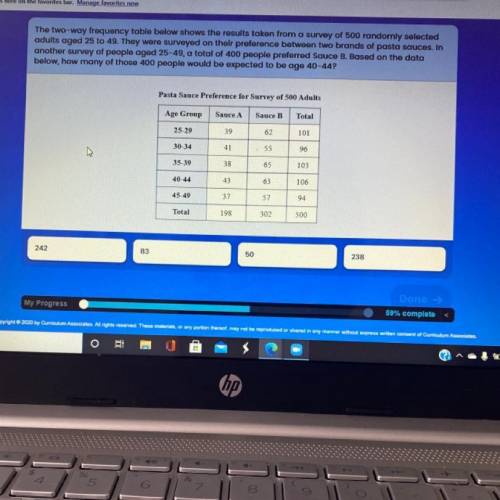
The two-way frequency table below shows the results taken from a survey of 500 randomly selected
adults aged 25 to 49. They were surveyed on their preference between two brands of pasta sauces. In
another survey of people aged 25-49, a total of 400 people preferred Sauce B. Based on the data
below, how many of those 400 people would be expected to be age 40-44?

Answers: 2
Another question on Mathematics
Mathematics, 21.06.2019 19:30
Lin is writing an equation to model the proportional relationship between y, the total cost in dollars of downloading videos from a website, and x, the number of videos downloaded. she knows that the total cost to download 3 videos was $12. her work to find the equation is shown below. joylin’s work step 1 k= 3/12= 0.25 step 2 y= 0.25x where did joylin make her first error?
Answers: 2
Mathematics, 22.06.2019 00:00
Need plz been trying to do it for a long time and still haven’t succeeded
Answers: 1
You know the right answer?
The two-way frequency table below shows the results taken from a survey of 500 randomly selected
ad...
Questions


Chemistry, 25.02.2020 14:10
Mathematics, 25.02.2020 14:10

Physics, 25.02.2020 14:22
Mathematics, 25.02.2020 14:24

Geography, 25.02.2020 14:27
Mathematics, 25.02.2020 14:30

Biology, 25.02.2020 14:31
Mathematics, 25.02.2020 14:32
Mathematics, 25.02.2020 14:39
Mathematics, 25.02.2020 14:45
Physics, 25.02.2020 14:47


