
Mathematics, 20.10.2020 09:01 gabrielaperezcz
I. Collect data from several fast food chains on the number of fat calories and grams of saturated fat in menu items. Record at least 12 ordered pairs of (fat calories, grams of saturated fat). Organize your data in a table.
II. Make a scatter plot of the data on graph paper. Be sure to label the axes and use an appropriate title for the graph.
You may wish to use a graphing calculator, spread sheet, or other technology resource (such as the graphing utility link below) to aid you in graphing.
Create a Graph
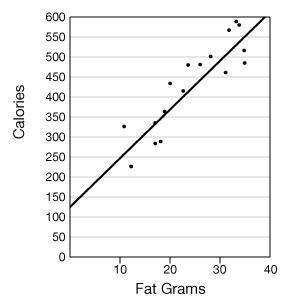
III. Draw a trend line for the scatter plot. Use the following scatter plot of the ordered pairs (fat grams, total calories) as an example.
IV. Calculate the slope of the trend line. (Choose two points on the line and find vertical change over horizontal change.)
Note: Graphing calculators and spread sheets have features with which to draw trend lines and determine the equation. You may choose to use one of these options. If you use technology, indicate what steps were taken to arrive at your equation.
V. Using the slope and y-intercept, write the equation of the trend line ( y = mx + b).
VI. Choose a "calories from fat" value that is not in your collected data set and that is at least 10 fat calories away from any collected value. Use the equation calculated in step V to predict the number of fat grams in an item having that number of fat calories. Be sure to show your work.
VII. Search for an item in a fast food menu having the same number of fat calories as the one you chose above. (If you cannot find the exact value, get as close as you can.) Compare the calculated value from step VI to this actual value. Explain why (or why not) you would have expected your prediction (calculated value) to be close to the actual value.

Answers: 3
Another question on Mathematics
Mathematics, 21.06.2019 19:00
Which statement best explains why ben uses the width hi to create the arc at j from point k
Answers: 2
Mathematics, 21.06.2019 19:40
Which is the solution to the inequality? 2 3/52 1/15 b< 3 2/15 b> 3 2/15
Answers: 1
Mathematics, 21.06.2019 22:30
Use the following statements to write a compound statement for the conjunction or disjunction. then find its truth value. p: an isosceles triangle has two congruent sides. q: a right angle measures 90° r: four points are always coplanar. s: a decagon has 12 sides. a) a right angle measures 90° or an isosceles triangle has two congruent sides; true. b) a right angle measures 90° and an isosceles triangle has two congruent sides; true. c) a right angle measures 90° and an isosceles triangle does not have two congruent sides; false. d) a right angle measures 90° or an isosceles triangle does not have two congruent sides; true.
Answers: 3
Mathematics, 22.06.2019 02:30
From a group of 10 men and 8 women, 5 people are to be selected for a committee so that at least 4 men are on the committee. howmany ways can it be done?
Answers: 2
You know the right answer?
I. Collect data from several fast food chains on the number of fat calories and grams of saturated f...
Questions

Physics, 24.02.2021 22:30
Mathematics, 24.02.2021 22:30
Physics, 24.02.2021 22:30

Mathematics, 24.02.2021 22:30
Physics, 24.02.2021 22:30

Social Studies, 24.02.2021 22:30

Biology, 24.02.2021 22:30

Mathematics, 24.02.2021 22:30

Mathematics, 24.02.2021 22:30

Spanish, 24.02.2021 22:30


