
Mathematics, 20.10.2020 04:01 Alangs
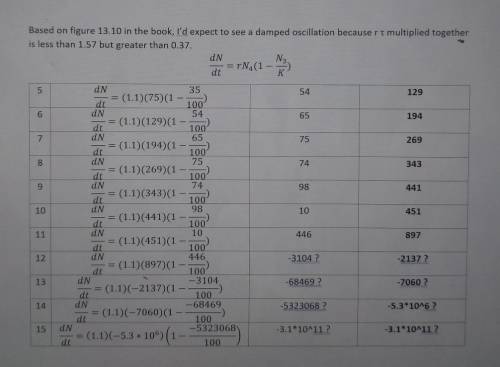
Using data provided, calculate the population size of the plant from year 5 through year 15. based on the product of rt, what type of oscillating behavior do you expect to see in the population even before doing the calculations? graph the results.
data provided:
K=100
t=1
r=1.1
=rN2(1-(N1/K))
There are 10 plants per square meter in year 1 and 20 plants in year 2. based on the data what is the expected change in population in year 3.
(1.1)(20)(1- (10/100) =20
20+20= 40 individuals in year 3
year 4: (1.1)(40)(1- (20/100) =35
35 + 40= 75 individuals
I solved this but I ended up getting negative numbers. I'm not sure what I did wrong or if I even did anything wrong. please help

Answers: 3
Another question on Mathematics
Mathematics, 21.06.2019 22:30
What is the common difference for this arithmetic sequence? -6,-2,2,6,10 a.4 b.5 c.3 d.6
Answers: 1
Mathematics, 21.06.2019 23:00
How many heads would you expect if you flipped a coin twice? first, fill in the table below with the correct probabilities. hint: the sample space for flipping a coin twice is {hh, ht, th, tt}. a = b = c = f
Answers: 1
Mathematics, 21.06.2019 23:30
In an isosceles triangle, the vertex angle is 112 degrees. what is the measure of each base. a.34 b.24 c.44 d.54
Answers: 1
You know the right answer?
Using data provided, calculate the population size of the plant from year 5 through year 15. based o...
Questions
Mathematics, 09.12.2020 21:40

Social Studies, 09.12.2020 21:40

Chemistry, 09.12.2020 21:40
Mathematics, 09.12.2020 21:40
Chemistry, 09.12.2020 21:40


Biology, 09.12.2020 21:40
Mathematics, 09.12.2020 21:40

Mathematics, 09.12.2020 21:40
History, 09.12.2020 21:40
History, 09.12.2020 21:40


