
Mathematics, 20.10.2020 01:01 jessica94866
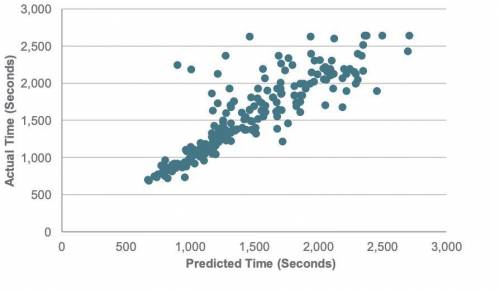
AP Statistics teachers from across the country meet annually in Kansas City to score AP Statistics exams. One social event that many teachers participate in is the annual Prediction Fun Run. Prior to the race, the teachers predict how long it will take them to complete the 1.96-mile long course. During the event, they are timed and their actual finishing times are paired with their predicted times. Here is a scatterplot of the results.
The winner of the race is not the fastest runner, but the most accurate runner.
a) Let x = the runner’s predicted time (in seconds) and y = the runner’s actual time (in seconds). Provide the equation of the line that can be used to assess how accurate the runners were. Plot this line on the graph above. Clearly label two points you are using to plot the line.
b) Is the line you drew in part (a) a least-squares regression line for these data? Explain.
c) While many runners were quite good at predicting their race time, some runners did very poorly at this task. Circle the point of the runner who had the largest error in prediction. Justify your choice. Was this runner faster or slower than predicted?
d) Describe the relationship between predicted time and actual time. Are all runners able to predict their actual times approximately equally well?

Answers: 3

Another question on Mathematics
Mathematics, 21.06.2019 14:30
Select the correct answer. what is the surface area of the victory podium shown here? include all surfaces of the podium, including the bottom. a. 61.5 square feet b. 61.75 square feet c. 65.25 square feet d. 69 square feet
Answers: 2
Mathematics, 21.06.2019 18:00
Express in the simplest form: (x^2+9x+14/x^2-49) / (3x+6/x^2+x-56)
Answers: 3
Mathematics, 21.06.2019 20:00
What is the x-intercept and y-intercept of the equation 2x+1. 2o
Answers: 2
Mathematics, 21.06.2019 20:00
Someone answer asap for ! max recorded the heights of 500 male humans. he found that the heights were normally distributed around a mean of 177 centimeters. which statements about max’s data must be true? a. the median of max’s data is 250 b. more than half of the data points max recorded were 177 centimeters. c. a data point chosen at random is as likely to be above the mean as it is to be below the mean. d. every height within three standard deviations of the mean is equally likely to be chosen if a data point is selected at random.
Answers: 1
You know the right answer?
AP Statistics teachers from across the country meet annually in Kansas City to score AP Statistics e...
Questions
Mathematics, 08.05.2021 20:20

Chemistry, 08.05.2021 20:20

Physics, 08.05.2021 20:20
Mathematics, 08.05.2021 20:20
Mathematics, 08.05.2021 20:30
Mathematics, 08.05.2021 20:30

Arts, 08.05.2021 20:30

History, 08.05.2021 20:30
Mathematics, 08.05.2021 20:30


English, 08.05.2021 20:30

Law, 08.05.2021 20:30
Physics, 08.05.2021 20:30


