
Mathematics, 17.10.2020 14:01 evanwall91
The population of a species in the wild in Asia has been decreasing exponentially since 1980. This function represents the wild population of the species t years after 1980: W(t)=20000(0.95)t.
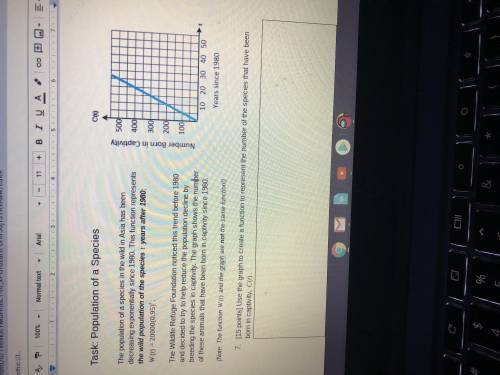
The Wildlife Refuge Foundation noticed this trend before 1980
and decided to try to help reduce the population decline by
breeding the species in captivity. The graph shows the number
of these animals that have been born in captivity since 1980.
(Note: The function W(t) and the graph are not the same function!)
[15 points] Use the graph to create a function to represent the number of the species that have been born in captivity, C(t).

Answers: 3
Another question on Mathematics
Mathematics, 21.06.2019 16:00
Which graph represents the solution set for the given system of inequalities? x+2y< 3 x+y> 4 3x-2y> 4
Answers: 2
Mathematics, 21.06.2019 19:00
Kayla and alberto are selling fruit for a school fundraiser. customers can buy small boxes of grapefruit and large boxes of grapefruit. kayla sold 3 small boxes of grapefruit and 1 large box of grapefruit for a total of $65. alberto sold 1 small box of grapefruit and 1 large box of grapefruit for a total of $55. what is the cost each of one small box of grapefruit and one large box of grapefruit?
Answers: 1
Mathematics, 21.06.2019 23:30
In the equation sqrt(n+5)-sqrt(11-10)=1. what is the value of n
Answers: 1
Mathematics, 22.06.2019 01:30
In the figure below, m∠r is 60°, and m∠t is 120°. what is m∠q? a. 60° b. 30° c. 120° d. 54
Answers: 1
You know the right answer?
The population of a species in the wild in Asia has been decreasing exponentially since 1980. This f...
Questions
Mathematics, 27.04.2021 19:40


Chemistry, 27.04.2021 19:40


Computers and Technology, 27.04.2021 19:40
Mathematics, 27.04.2021 19:40
Mathematics, 27.04.2021 19:40


