
Mathematics, 16.10.2020 17:01 taijaunam
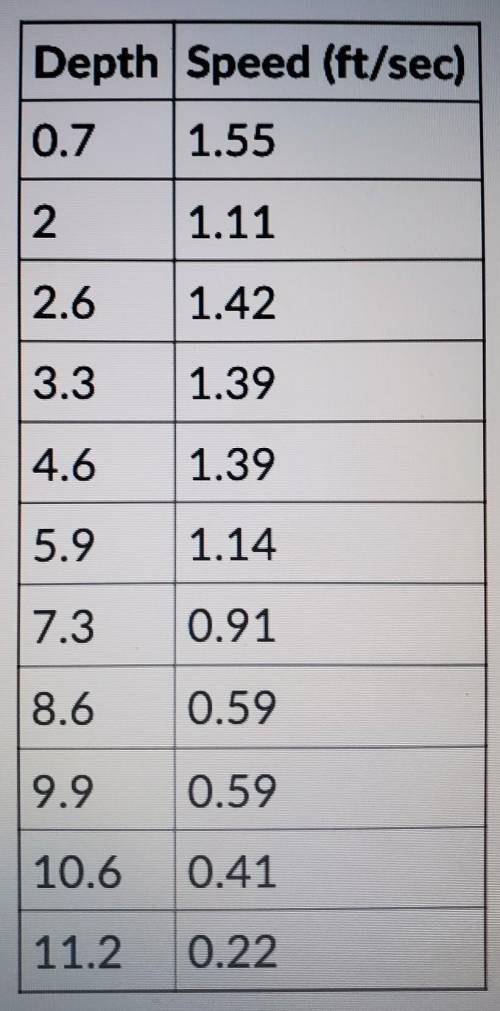
Data collected on the depth of the Nile River in the speed at which the river travels are given in the table:
Find r², and interpret the results.
A: 0.88; The least-squares regression line, given by ŷ=1.68-0.12x, is a good fit for the data.
B: -0.94; The least-squares regression line, given by ŷ=1.68-0.12x, is a good fit for the data.
C: 0.88; The least-squares regression line, given by ŷ=-0.12+1.68x, is not a good fit for the data.
D: -0.94; The least-squares regression line, given by ŷ=-0.12+1.68x, is not a good fit for the data.
E: -0.12; The least-squares regression line, given by ŷ=1.68+0.88x, is not a good fit for the data.

Answers: 1
Another question on Mathematics
Mathematics, 21.06.2019 20:30
Drag the tiles to the correct boxes to complete the pairs. not all tiles will be used. match each division expression with the correct quotient.
Answers: 2
Mathematics, 21.06.2019 22:00
If abcde is reflected over the x-axis and then translated 3 units left, what are the new coordinates d?
Answers: 3
Mathematics, 21.06.2019 22:00
Using inductive reasoning, what is the next two numbers in this set? 1,-7,13,-19 i got the numbers 14,-26 is that right?
Answers: 2
Mathematics, 21.06.2019 22:30
Agallon of apple juice cost $7 a pack of eight 4.23oz box of apple juice $2.39 which is a better deal
Answers: 1
You know the right answer?
Data collected on the depth of the Nile River in the speed at which the river travels are given in t...
Questions


