
Mathematics, 16.10.2020 15:01 kortetsosie8813
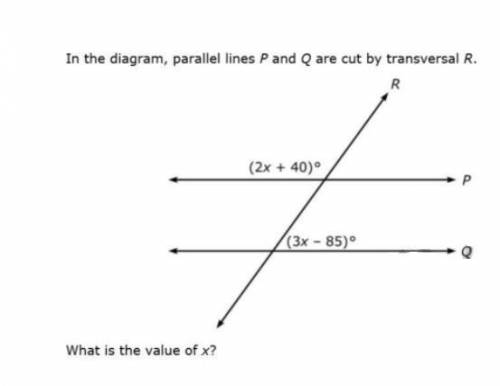
In the diagram, parallel lines P and Q are cut by transversal R.
What is the value of X?
Help! qwq

Answers: 2
Another question on Mathematics
Mathematics, 21.06.2019 15:30
In the figure below, segment ac is congruent to segment ab: triangle abc with a segment joining vertex a to point d on side bc. side ab is congruent to side ac which statement is used to prove that angle abd is congruent to angle acd? segment ad bisects angle cab. triangle acd is similar to triangle abd. segment ad is congruent to segment ac. angle cab is congruent to angle cba.
Answers: 2
Mathematics, 21.06.2019 22:00
Harry and jay are both flying on the same plane with an airline that randomly assigns seats to passengers. of the 182 total seats on the plane, 62 are window seats, 58 are middle seats, and the rest are aisle seats. what is the approximate probability that both harry and jay will be assigned aisle seats on the same plane? a. 11.48% b. 3.3% c. 2.08% d. 26.26%
Answers: 3
Mathematics, 21.06.2019 23:00
Each of the following data sets has a mean of x = 10. (i) 8 9 10 11 12 (ii) 7 9 10 11 13 (iii) 7 8 10 12 13 (a) without doing any computations, order the data sets according to increasing value of standard deviations. (i), (iii), (ii) (ii), (i), (iii) (iii), (i), (ii) (iii), (ii), (i) (i), (ii), (iii) (ii), (iii), (i) (b) why do you expect the difference in standard deviations between data sets (i) and (ii) to be greater than the difference in standard deviations between data sets (ii) and (iii)? hint: consider how much the data in the respective sets differ from the mean. the data change between data sets (i) and (ii) increased the squared difference îł(x - x)2 by more than data sets (ii) and (iii). the data change between data sets (ii) and (iii) increased the squared difference îł(x - x)2 by more than data sets (i) and (ii). the data change between data sets (i) and (ii) decreased the squared difference îł(x - x)2 by more than data sets (ii) and (iii). none of the above
Answers: 2
Mathematics, 21.06.2019 23:00
Someone answer this asap for the function f(x) and g(x) are both quadratic functions. f(x) = x² + 2x + 5 g(x) = x² + 2x - 1 which statement best describes the graph of g(x) compared to the graph of f(x)? a. the graph of g(x) is the graph of f(x) shifted down 1 units. b. the graph of g(x) is the graph of f(x) shifted down 6 units. c. the graph of g(x) is the graph of f(x) shifted to the right 1 unit. d. the graph of g(x) is the graph of f(x) shifted tothe right 6 units.
Answers: 3
You know the right answer?
In the diagram, parallel lines P and Q are cut by transversal R.
What is the value of X?
Questions
Mathematics, 08.04.2021 22:30

Mathematics, 08.04.2021 22:30
Mathematics, 08.04.2021 22:30
Mathematics, 08.04.2021 22:30
Mathematics, 08.04.2021 22:30

Social Studies, 08.04.2021 22:30

Business, 08.04.2021 22:30


Mathematics, 08.04.2021 22:30

Chemistry, 08.04.2021 22:30


