Unit 2 – Economic Environment
Supply & Demand of Orange Juice Study
Directions: Lab...

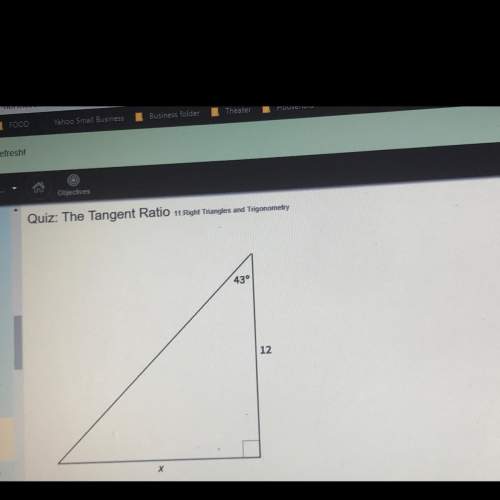
Mathematics, 16.10.2020 17:01 manarsadi6
Unit 2 – Economic Environment
Supply & Demand of Orange Juice Study
Directions: Label the graph according to the following information.
(X-Axis: increments of 10; Y-Axis: increments of 20)
Graph the supply and demand curves for orange juice on the chart.
PEOPLE WOULD STORES WOULD
BUY/DEMAND SUPPLY/SELL
PRICE (Million half gallons) (Million half gallons)
$0.60 55 25
$0.80 40 40
$1.20 25 55
$1.60 10 70
$2.00 5 85
$2.40 1 90
Quantity (Millions of half-gallons per Day)

Answers: 1
Another question on Mathematics
Mathematics, 21.06.2019 14:30
The circumference of a circle is 5 pi cm. what is the area of the circle?
Answers: 2
Mathematics, 21.06.2019 15:10
6x - 8 = 16 solve the following equation. then place the correct number in the box provided.
Answers: 2
Mathematics, 21.06.2019 21:50
Which equation shows the quadratic formula used correctly to solve 5x2 + 3x -4 0 for x? cos -3+ v (3) 2-4() 2(5) 3+ |(3)² +4() 205) 3+ (3) 2-4() -3+ v (3)² +4()
Answers: 1
Mathematics, 21.06.2019 22:30
If a and −a are numbers on the number line, which expression must give the distance between them? a) 0 b) a c) |2a| d) |a|
Answers: 1
You know the right answer?
Questions


Computers and Technology, 31.10.2019 04:31


