
Mathematics, 13.10.2020 16:01 memester74
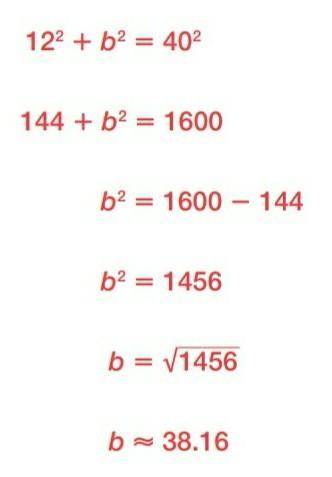
IF YOU CAN HELP ME I WILL LITERALLY BE SO HAPPY AND ILL FAV U TO GET SO MANY POINTS THE WATER COMPANY INSTALLED A 40 YARD DIAGONAL BRACE ON A WATER TOWER BETWEEN TWO VERTICAL BEAMS THAT ARE 12 YARDS APART. DETERMINE THE HEIGHT OF EACH VERTICAL BEAM.

Answers: 1
Another question on Mathematics
Mathematics, 21.06.2019 19:30
Needmax recorded the heights of 500 male humans. he found that the heights were normally distributed around a mean of 177 centimeters. which statements about max’s data must be true? a) the median of max’s data is 250 b) more than half of the data points max recorded were 177 centimeters. c) a data point chosen at random is as likely to be above the mean as it is to be below the mean. d) every height within three standard deviations of the mean is equally likely to be chosen if a data point is selected at random.
Answers: 2
Mathematics, 21.06.2019 20:10
21 type the correct answer in the box. use numerals instead of words. if necessary, use / for the fraction bar. the solution set of n2 - 14n = -45 is { (separate the solutions with a comma)
Answers: 3
Mathematics, 21.06.2019 20:20
One of every 20 customers reports poor customer service on your company’s customer satisfaction survey. you have just created a new process that should cut the number of poor customer service complaints in half. what percentage of customers would you expect to report poor service after this process is implemented? 1.) 5% 2.) 10% 3.) 2% 4.) 2.5%
Answers: 1
Mathematics, 22.06.2019 02:00
1. the manager of collins import autos believes the number of cars sold in a day (q) depends on two factors: (1) the number of hours the dealership is open (h) and (2) the number of salespersons working that day (s). after collecting data for two months (53 days), the manager estimates the following log-linear model: q 4 equation 1 a. explain, how to transform the log-linear model into linear form that can be estimated using multiple regression analysis. the computer output for the multiple regression analysis is shown below: q4 table b. how do you interpret coefficients b and c? if the dealership increases the number of salespersons by 20%, what will be the percentage increase in daily sales? c. test the overall model for statistical significance at the 5% significance level. d. what percent of the total variation in daily auto sales is explained by this equation? what could you suggest to increase this percentage? e. test the intercept for statistical significance at the 5% level of significance. if h and s both equal 0, are sales expected to be 0? explain why or why not? f. test the estimated coefficient b for statistical significance. if the dealership decreases its hours of operation by 10%, what is the expected impact on daily sales?
Answers: 2
You know the right answer?
IF YOU CAN HELP ME I WILL LITERALLY BE SO HAPPY AND ILL FAV U TO GET SO MANY POINTS
THE WATER COMPA...
Questions


Biology, 19.09.2019 04:40

Mathematics, 19.09.2019 04:40
Mathematics, 19.09.2019 04:40

Health, 19.09.2019 04:40

Mathematics, 19.09.2019 04:40
Mathematics, 19.09.2019 04:40
Mathematics, 19.09.2019 04:40
Mathematics, 19.09.2019 04:40
Mathematics, 19.09.2019 04:40
Biology, 19.09.2019 04:40

Social Studies, 19.09.2019 04:40
Mathematics, 19.09.2019 04:40


