
Mathematics, 13.10.2020 03:01 jcox626
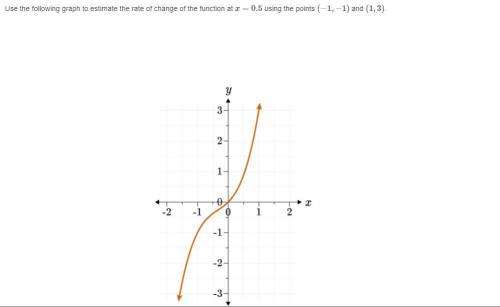
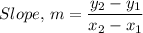
2.Use the following graph to estimate the rate of change of the function at x=0.5 using the points (−1,−1) and (1,3)
A. The rate of change is −1/2.
B. The rate of change is 2.
C. The rate of change is 1/2.
D. The rate of change is −2.
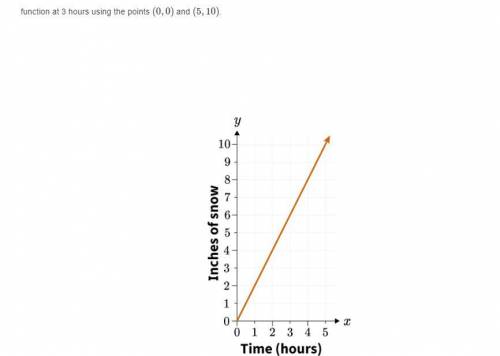
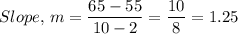
3.The following graph shows the inches of snow on the ground over a certain number of hours. Use the graph to estimate the rate of change of the function at 3 hours using the points (0,0) and (5,10)
A. The rate of change is −1/2 of an inch per hour.
B. The rate of change is 1/2 of an inch per hour.
C. The rate of change is 2 inches per hour.
D. The rate of change is −2 inches per hour.
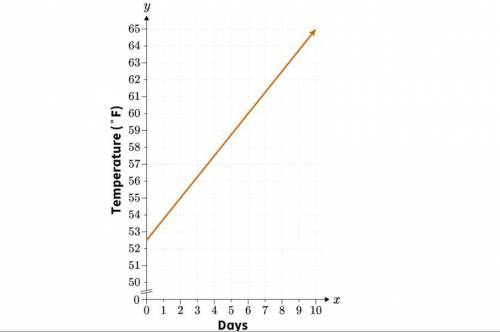
4.The following graph shows the average temperatures in degrees Fahrenheit (°F) over the days of a month. Use the graph to estimate the rate of change of the function at the ninth day of the month using the points (2,55) and (10,65)
A. The rate of change is 0.8 degrees Fahrenheit per day.
B. The rate of change is 1.25 degrees Fahrenheit per day.
C. The rate of change is −0.8 degrees Fahrenheit per day.
D. The rate of change is −1.25 degrees Fahrenheit per day.
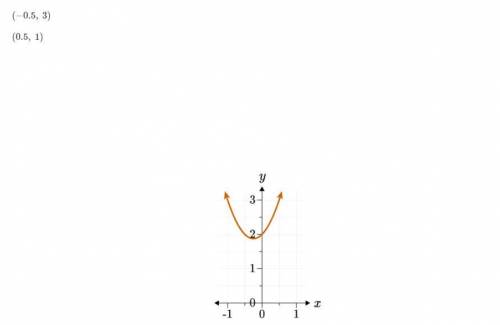
5.Use the following graph to answer which of the following points would provide the most accurate estimation for the rate of change of the function as it crosses the y-axis. Explain.
(−0.5, 2)
(0.5, 3)
(−0.5, 3)
(0.5, 1)
A.(−0.5, 3) and (0.5, 1) would provide the most accurate estimation. The slope of the line drawn between these two points appears closest to the slope of the function at x=0.
B.(−0.5, 2) and (0.5, 3) would provide the most accurate estimation. The slope of the line drawn between these two points appears closest to the opposite of the slope of the function at x=0.
C.(−0.5, 2) and (0.5, 3) would provide the most accurate estimation. The slope of the line drawn between these two points appears closest to the slope of the function at x=0.
D.(−0.5, 3) and (0.5, 1) would provide the most accurate estimation. The slope of the line drawn between these two points appears closest to the opposite of the slope of the function at x=0.

Answers: 3
Another question on Mathematics
Mathematics, 21.06.2019 17:00
What is the arc length when θ =pi over 3 and the radius is 5 cm? (5 points) 5 pi over 3 cm 10 pi over 3 cm 16 pi over 3 cm pi over 3 cm
Answers: 1
Mathematics, 21.06.2019 21:00
What number line represents the solution set for the inequality -1/2 greater than or equal to 4
Answers: 1
Mathematics, 21.06.2019 21:10
Given: lines a and b are parallel and line c is a transversal. prove: 2 is supplementary to 8 what is the missing reason in the proof? statement reason 1. a || b, is a transv 1. given 2. ∠6 ≅ ∠2 2. ? 3. m∠6 = m∠2 3. def. of congruent 4. ∠6 is supp. to ∠8 4. def. of linear pair 5. ∠2 is supp. to ∠8 5. congruent supplements theorem corresponding angles theorem alternate interior angles theorem vertical angles theorem alternate exterior angles theorem
Answers: 3
Mathematics, 22.06.2019 00:00
Titus works at a hotel. part of his job is to keep the complimentary pitcher of water at least half full and always with ice. when he starts his shift, the water level shows 4 gallons, or 128 cups of water. as the shift progresses, he records the level of the water every 10 minutes. after 2 hours, he uses a regression calculator to compute an equation for the decrease in water. his equation is w –0.414t + 129.549, where t is the number of minutes and w is the level of water. according to the equation, after about how many minutes would the water level be less than or equal to 64 cups?
Answers: 2
You know the right answer?
2.Use the following graph to estimate the rate of change of the function at x=0.5 using the points (...
Questions
Mathematics, 19.05.2020 16:05

Biology, 19.05.2020 16:05

History, 19.05.2020 16:05
Mathematics, 19.05.2020 16:05
History, 19.05.2020 16:05

Mathematics, 19.05.2020 16:05
English, 19.05.2020 16:05
Mathematics, 19.05.2020 16:05
Mathematics, 19.05.2020 16:05
Mathematics, 19.05.2020 16:05

Geography, 19.05.2020 16:05
Biology, 19.05.2020 16:05
Mathematics, 19.05.2020 16:05


