Who
is table on your answer sheet.
The table below shows the sales for a flower company for t...

Mathematics, 05.10.2020 18:01 tdowling331
Who
is table on your answer sheet.
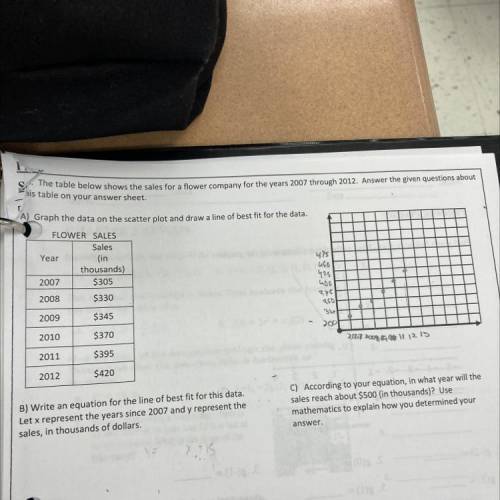
The table below shows the sales for a flower company for the years 2007 through 2012. Answer the given questions about
A) Graph the data on the scatter plot and draw a line of best fit for the data,
5
5
FLOWER SALES
Sales
Year
(in
thousands)
2007 $305
475
ubo
425
2008
$330
27
2009
$345
2010
$370
SO 11 12 13
2011
$395
2012
$420
B) Write an equation for the line of best fit for this data.
Let x represent the years since 2007 and y represent the
sales, in thousands of dollars.
C) According to your equation, in what year will the
sales reach about $500 (in thousands)? Use
mathematics to explain how you determined your
answer.

Answers: 3
Another question on Mathematics
Mathematics, 21.06.2019 20:00
The marked price of an article is 25% above its selling price and the cost price is 30% less than its marked price . find the discount percent and gain percent. only a brainlest can solve it i will mark you brainlest
Answers: 2
Mathematics, 22.06.2019 00:30
Can someone me find the original price? the discount is 5% and the sale price is $68.40
Answers: 1
You know the right answer?
Questions


Computers and Technology, 24.10.2019 16:43


