
Mathematics, 22.09.2020 09:01 nally6636
07.02 Analyzing Exponential Functions Project
How much do you share on social media? Do you have accounts linked to your computer, phone, and tablet? The average teen spends
around 9 hours per day online, and checks his or her social media account about 10 times each day.
When an image or post is shared publicly, some students are surprised at how quickly their information travels across the Internet. The
scary part is that nothing online is really private. All it takes is one friend sharing your photo or updates with the public to create a very
public viral trend
For this project, you will use what you have learned about exponential functions to study what happens if a social media post is shared.
Format
1,2,3
Numb
Ca
Su
Cre
Social Sharing
You and your partner will each study 2 student scenarios to see how social media spreads. Four student scenarios are described in the
table below. Work together with your partner to decide on who will study which two students.
Student Harrison
Anita
Juan
Krista
Description Harrison shared his video with Anita shared her photo with 41 Juan shared his post with 4 Krista shared her photo
7 friends. His friends
followers. Each of them shared friends, who each shared it with with 6 friends, who each
continued to share it,
it with 2 friends, doubling the 4 more friends. They continued shared it with 3 friends.
doubling the number of number of viewers each day sharing at the same rate. This pattern continued.
viewers each day
Social
Day Viewers
Juan shared his post with 4
Media
0 41
friends, who each shared it with
Shares
1
82
4 more friends. They continued
2 164
sharing at the same rate.
f(x) = 7(2)
f(x) = 6(3)*
Place your answers in the yellow highlighted areas below.
State which two students you are studying so your instructor knows for whom each partner is responsible.
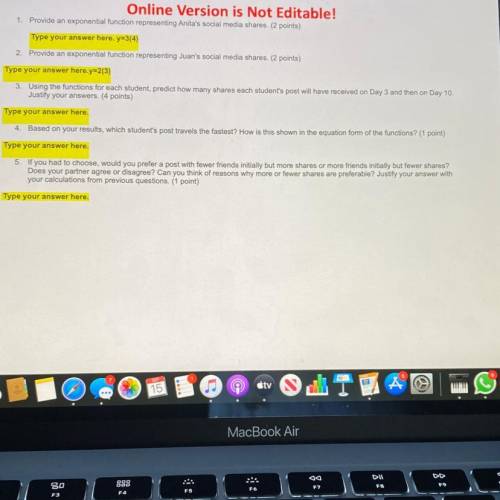

Answers: 2
Another question on Mathematics
Mathematics, 21.06.2019 16:10
The number of hours per week that the television is turned on is determined for each family in a sample. the mean of the data is 37 hours and the median is 33.2 hours. twenty-four of the families in the sample turned on the television for 22 hours or less for the week. the 13th percentile of the data is 22 hours. approximately how many families are in the sample? round your answer to the nearest integer.
Answers: 1
Mathematics, 21.06.2019 17:00
High schoolmathematics 5 points keith is the leading goal scorer for a team in an ice hockey league. last season, he scored 42 goals in 82 games. assuming he scores goals at a constant rate, what is the slope of the line that represents this relationship if the number of games is along the x-axis and the number of goals is along the y-axis?
Answers: 1
Mathematics, 21.06.2019 20:00
Which type of graph would allow us to quickly see how many students between 100 and 200 students were treated?
Answers: 1
Mathematics, 21.06.2019 20:40
Askate shop rents roller skates as shown on the table below. which graph and function models this situation?
Answers: 1
You know the right answer?
07.02 Analyzing Exponential Functions Project
How much do you share on social media? Do you have ac...
Questions

English, 05.05.2021 19:50
Mathematics, 05.05.2021 19:50


Arts, 05.05.2021 19:50

Mathematics, 05.05.2021 19:50

Mathematics, 05.05.2021 20:00
Mathematics, 05.05.2021 20:00
Mathematics, 05.05.2021 20:00
Mathematics, 05.05.2021 20:00
English, 05.05.2021 20:00

Social Studies, 05.05.2021 20:00


