
Mathematics, 21.09.2020 14:01 vickiw
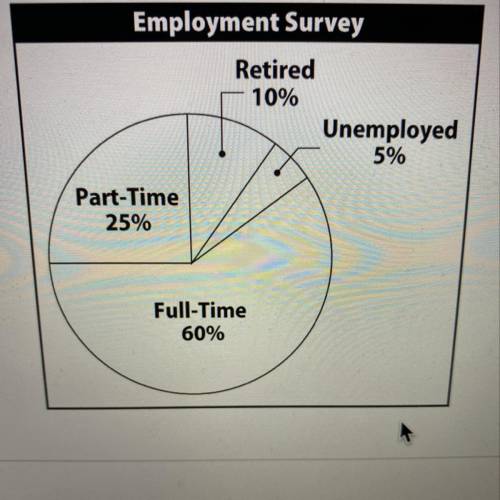
The circle graph shows the results of an employment survey of 800 people. How
many of the people surveyed were unemployed?
Employment Survey
Retired
10%
Unemployed
5%
Part-Time
25%
Full-Time
60%
A.40
B.120
C.20
D.80

Answers: 3
Another question on Mathematics
Mathematics, 20.06.2019 18:04
Yuri, sam and dani had the same math homework last night, but none of them finished it. yuri finished 3/8 of her homework, sam finished 4/6 of her homework and dani finished 1/2. who finished the most math homework? who finished the least amount?
Answers: 1
Mathematics, 21.06.2019 23:10
Tom travels between the two mile markers shown and then finds his average speed in miles per hour. select the three equations that represent this situation.
Answers: 1
Mathematics, 22.06.2019 00:00
Two poles, ab and ed, are fixed to the ground with the of ropes ac and ec, as shown: what is the approximate distance, in feet, between the two poles? 6.93 feet 8.66 feet 12.32 feet 15.59 feet
Answers: 1
You know the right answer?
The circle graph shows the results of an employment survey of 800 people. How
many of the people su...
Questions
Mathematics, 01.12.2020 23:30

English, 01.12.2020 23:30

Biology, 01.12.2020 23:30

Biology, 01.12.2020 23:30
Mathematics, 01.12.2020 23:30

Mathematics, 01.12.2020 23:30

Mathematics, 01.12.2020 23:30


