
Mathematics, 20.09.2020 03:01 desireeandrada9
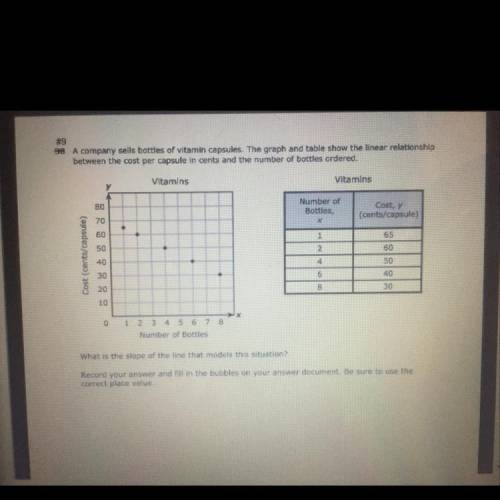
A company sells bottles of vitamin capsules. The graph and table show the linear relationship
between the cost per capsule in cents and the number of bottles ordered.
Vitamins
Vitamins
80
Number of
Bottles,
Cost, y
(cents/capsule)
65
50
60
Cost (cents/capsule)
40
4
30
6
020
0
1
2
Number of Botties
What is the slope of the line that models this situation?

Answers: 2
Another question on Mathematics
Mathematics, 21.06.2019 16:00
The equation x2 – 1x – 90 = 0 has solutions {a, b}. what is a + b?
Answers: 1
Mathematics, 21.06.2019 22:30
Which expressions equal 9 when x=4 and y=1/3 a. x2+6y b. 2x + 3y c. y2-21x d. 5 (x/2) -3y e. 3x-9y
Answers: 2
Mathematics, 22.06.2019 02:00
Taylor graphs the system below on her graphing calculator and decides that f(x)=g(x) at x=0, x=1, and x=3. provide taylor with some feedback that explains which part of her answer is incorrect and why it is incorrect. f(x)= 2x+1 g(x)= 2x^2+1
Answers: 2
You know the right answer?
A company sells bottles of vitamin capsules. The graph and table show the linear relationship
betwe...
Questions

History, 04.12.2020 20:30

Biology, 04.12.2020 20:30

Mathematics, 04.12.2020 20:30


English, 04.12.2020 20:30
Mathematics, 04.12.2020 20:30
History, 04.12.2020 20:30
Mathematics, 04.12.2020 20:30
Mathematics, 04.12.2020 20:30


