
Mathematics, 17.08.2020 01:01 reinasuarez964
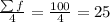
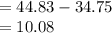
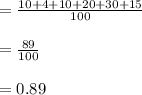
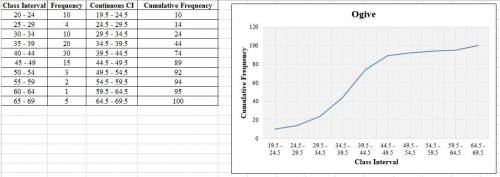
The following table shows scores obtained in an examination by B. Ed JHS Specialism students. Use the information to answer the questions that follow: Score 20-24 25-29 30-34 35-39 40-44 45-49 50-54 55-59 60-64 65-69 Frequency 10 4 10 20 30 15 3 2 1 5.a. Construct a cumulative frequency curve for the data. b. Find the; i. inter-quartile range. ii. 70th percentile class scores. iii. probability that a student scored at most 50 on the examination

Answers: 1
![Q_{1}=l+[\frac{(\sum f/4)-(CF)_{p}}{f}]\times h](/tpl/images/0723/2115/19830.png)
 = cumulative frequency of the previous class = 24
![=34.5+[\frac{25-24}{20}]\times5\\\\=34.5+0.25\\=34.75](/tpl/images/0723/2115/afa09.png)
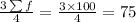
![Q_{3}=l+[\frac{(3\sum f/4)-(CF)_{p}}{f}]\times h](/tpl/images/0723/2115/4a744.png)
![=44.5+[\frac{75-74}{15}]\times5\\\\=44.5+0.33\\=44.83](/tpl/images/0723/2115/0202c.png)


Another question on Mathematics
Mathematics, 21.06.2019 18:30
An ulcer medication has 300 milligrams in 2 tablets. how many milligrams are in 3 tablets?
Answers: 1
Mathematics, 21.06.2019 18:30
Over the last 8 nights, elyse earned the following in tips: {105, 120, 84, 95, 100, 132, 140}. if she earns $140 a night for the next four nights, which measure of center would increase more, the mean or median?
Answers: 3
Mathematics, 21.06.2019 19:10
What is the quotient of m^6/5 ÷ 5/m^2? assume m does not equal pl
Answers: 1
You know the right answer?
The following table shows scores obtained in an examination by B. Ed JHS Specialism students. Use th...
Questions
Mathematics, 19.05.2021 22:30
Mathematics, 19.05.2021 22:30
Mathematics, 19.05.2021 22:30


Mathematics, 19.05.2021 22:30


History, 19.05.2021 22:40
Mathematics, 19.05.2021 22:40

History, 19.05.2021 22:40
Mathematics, 19.05.2021 22:40


