
Mathematics, 17.08.2020 01:01 120175
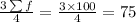
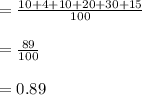
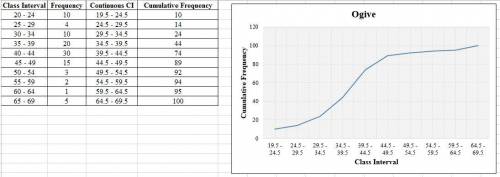
The following table shows scores obtained in an examination by B. Ed JHS Specialism students. Use the information to answer the questions that follow: Score 20-24 25-29 30-34 35-39 40-44 45-49 50-54 55-59 60-64 65-69 Frequency 10 4 10 20 30 15 3 2 1 5.a. Construct a cumulative frequency curve for the data. b. Find the; i. inter-quartile range. ii. 70th percentile class scores. iii. probability that a student scored at most 50 on the examination Please is urgent .can I get help

Answers: 1
![Q_{1}=l+[\frac{(\sum f/4)-(CF)_{p}}{f}]\times h](/tpl/images/0723/2391/19830.png)
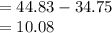
 = cumulative frequency of the previous class = 24
![=34.5+[\frac{25-24}{20}]\times5\\\\=34.5+0.25\\=34.75](/tpl/images/0723/2391/afa09.png)
![Q_{3}=l+[\frac{(3\sum f/4)-(CF)_{p}}{f}]\times h](/tpl/images/0723/2391/4a744.png)
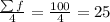
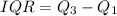
![=44.5+[\frac{75-74}{15}]\times5\\\\=44.5+0.33\\=44.83](/tpl/images/0723/2391/0202c.png)

Another question on Mathematics
Mathematics, 21.06.2019 20:20
How do the number line graphs of the solutions sets of -23 > x and x-23 differ?
Answers: 1
Mathematics, 21.06.2019 21:40
Astudy was interested in determining if eating milk chocolate lowered someone's cholesterol levels.ten people's cholesterol was measured. then, each of these individuals were told to eat 100g of milk chocolate every day and to eat as they normally did. after two weeks, their cholesterol levels were measured again. is there evidence to support that their cholesterol levels went down? how should we write the alternative hypothesis? (mud = the population mean difference= before - after)a. ha: mud = 0b. ha: mud > 0c. ha: mud < 0d. ha: mud does not equal 0
Answers: 1
Mathematics, 21.06.2019 23:30
On the day a coffee shop first opened, it had 140 customers. 65% of the customers ordered a large coffee. how many customers ordered a large coffee? enter your answer in the box.
Answers: 1
You know the right answer?
The following table shows scores obtained in an examination by B. Ed JHS Specialism students. Use th...
Questions

History, 14.10.2019 12:30

Mathematics, 14.10.2019 12:30

Biology, 14.10.2019 12:30
History, 14.10.2019 12:30

Geography, 14.10.2019 12:30
Mathematics, 14.10.2019 12:30

English, 14.10.2019 12:30
History, 14.10.2019 12:30
Mathematics, 14.10.2019 12:30

History, 14.10.2019 12:30


