
Mathematics, 12.08.2020 05:01 dookeyb2
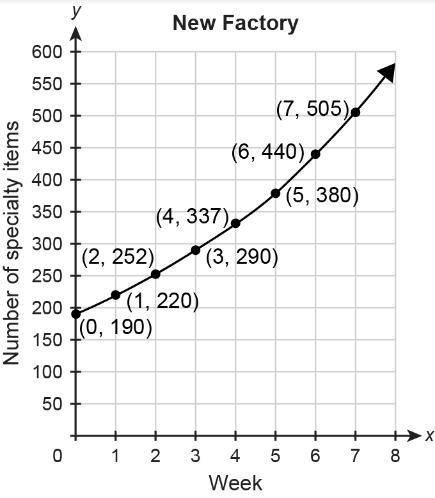
The function represents the number of specialty items produced at the old factory w weeks after a change in management. The graph represents the number of specialty items produced at the new factory a) During Week 0, how many more specialty items were produced at the old factory than at the new factory? Explain. b) Find and compare the growth rates in the weekly number of specialty items produced at each factory. Show your work. c) When does the weekly number of specialty items produced at the new factory exceed the weekly number of specialty items produced at the old factory? Explain.

Answers: 3
Another question on Mathematics
Mathematics, 20.06.2019 18:04
You have two cards with a sum of -12 in both hands. a. what two cards could you have? b. you add two more cards to your hand, but the total sum if the cards remains the same, (-12).
Answers: 1
Mathematics, 21.06.2019 17:00
You have $600,000 saved for retirement. your account earns 5.5% interest. how much, to the nearest dollar, will you be able to pull out each month, if you want to be able to take withdrawals for 20 years?
Answers: 1
Mathematics, 21.06.2019 17:30
Daniel bought a computer game for $25 and later sold it to thomas for a 40% profit. how much did daniel sell the computer game for?
Answers: 1
Mathematics, 21.06.2019 18:30
The table shows the relationship between the number of cups of cereal and the number of cups of raisins in a cereal bar recipe: number of cups of cereal number of cups of raisins 8 2 12 3 16 4 molly plotted an equivalent ratio as shown on the grid below: a graph is shown. the title of the graph is cereal bars. the horizontal axis label is cereal in cups. the x-axis values are 0, 20, 40, 60, 80,100. the vertical axis label is raisins in cups. the y-axis values are 0, 10, 20, 30, 40, 50. a point is plotted on the ordered pair 40,20. which of these explains why the point molly plotted is incorrect? (a) if the number of cups of cereal is 40, then the number of cups of raisins will be10. (b)if the number of cups of raisins is 40, then the number of cups of cereal will be10. (c) if the number of cups of cereal is 40, then the number of cups of raisins will be 80. (d) if the number of cups of raisins is 40, then the number of cups of cereal will be 80.
Answers: 1
You know the right answer?
The function represents the number of specialty items produced at the old factory w weeks after a ch...
Questions


Mathematics, 28.10.2020 01:40
Mathematics, 28.10.2020 01:40

Chemistry, 28.10.2020 01:40
Mathematics, 28.10.2020 01:40
English, 28.10.2020 01:40
History, 28.10.2020 01:40

Medicine, 28.10.2020 01:40
Mathematics, 28.10.2020 01:40

Arts, 28.10.2020 01:40

World Languages, 28.10.2020 01:40
Mathematics, 28.10.2020 01:40
Mathematics, 28.10.2020 01:40


