
Mathematics, 01.08.2020 01:01 kaysayfam747
The accompanying data represent the total travel tax (in dollars) for a 3-day business trip in randomly selected cities. A normal probability plot suggests the data could come from a population that is normally distributed. A boxplot indicates there are no outliers. Complete parts (a) through (c) below
68.87 78.25 70.44 84.67 79.79 86.33 100.24 98.26
(a) Determine a point estimate for the population mean travel tax
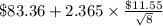
A point estimate for the population mean travel tax is $ 83.36. (Round to two decimal places as needed.)
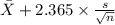
(b) Construct and interpret a 95% confidence interval for the mean tax paid for a three-day business trip.
Select the correct choice below and fill in the answer boxes to complete your choice. (Round to two decimal places as needed.)
A. The lower bound is $ and the upper bound is $. One can be % confident that all cities have a travel tax between these values.
B. The lower bound is $ and the upper bound is $ The travel tax is between these values for % of all cities.
C. The lower bound is $ and the upper bound is $ There is a % probability that the mean travel tax for all cities is between these values.
D. The lower bound is $ and the upper bound is One can be [95]% confident that the mean travel tax for all cities is between these values.
(c) What would you recommend to a researcher who wants to increase the precision of the interval, but does not have access to additional data?
A. The researcher could decrease the level of confidence.
B. The researcher could decrease the sample standard deviation.
C. The researcher could increase the level of confidence
D. The researcher could increase the sample mean

Answers: 3
 =
= 

 = $83.36
 ~
~ 
 = $11.55
 = population mean travel tax
 <
<  <
<  ) = 0.95
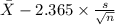 <
<  ) = 0.95
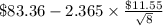 ,
,  ]
]
Another question on Mathematics
Mathematics, 21.06.2019 15:00
Idon’t understand this.. will someone ? will mark brainliest along with 20 points.
Answers: 1
Mathematics, 21.06.2019 16:10
The box plot shows the number of raisins found in sample boxes from brand c and from brand d. each box weighs the same. what could you infer by comparing the range of the data for each brand? a) a box of raisins from either brand has about 28 raisins. b) the number of raisins in boxes from brand c varies more than boxes from brand d. c) the number of raisins in boxes from brand d varies more than boxes from brand c. d) the number of raisins in boxes from either brand varies about the same.
Answers: 2
Mathematics, 21.06.2019 19:30
Asquare has a side that measures 11 units. what is the area of a circle with a circumference that equals the perimeter of the square? use 3.14 for π, and round your answer to the nearest hundredth. 1519.76 units2 379.94 units2 616.56 units2 154.14 units2
Answers: 1
Mathematics, 22.06.2019 02:00
Mr. roseanne will buy 12 1/2 pounds beef for for a cookout. the price for the first 3 pounds of beef is $4.99 per pound. after that, the price is $4.49 per pound. how much will mr.roshan pay for the beef
Answers: 1
You know the right answer?
The accompanying data represent the total travel tax (in dollars) for a 3-day business trip in rando...
Questions


Social Studies, 04.02.2020 22:00


History, 04.02.2020 22:00
Mathematics, 04.02.2020 22:00

Biology, 04.02.2020 22:00
Mathematics, 04.02.2020 22:00
Biology, 04.02.2020 22:00
Mathematics, 04.02.2020 22:00
Mathematics, 04.02.2020 22:00


Geography, 04.02.2020 22:00
Social Studies, 04.02.2020 22:00

Biology, 04.02.2020 22:00


