What is the area of the sector shown in the diagram below?
A.
50 cm2
B.
11....

Mathematics, 29.07.2020 23:01 mstrish71oteauw
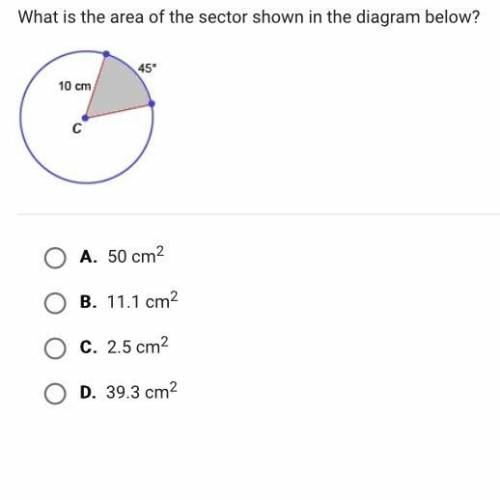
What is the area of the sector shown in the diagram below?
A.
50 cm2
B.
11.1 cm2
C.
2.5 cm2
D.
39.3 cm2

Answers: 3
Another question on Mathematics
Mathematics, 21.06.2019 14:00
The jones farm has 24 cows that each produce 52 quarts of milk a day. how many quarts are produced each day altogether
Answers: 1
Mathematics, 21.06.2019 15:30
Adepartment store purchases screen-printed t-shirts at a cost of $5 per shirt. they mark up the price 150% (making the selling price 250% of the store's purchase price) and put them on the sales floor. every month that a t-shirt doesn't sell, the store reduces the selling price by 25%.
Answers: 3
Mathematics, 21.06.2019 17:30
One line passes through (-7,-4) and (5,4) . another line passes through the point (-4,6) and (6,-9)
Answers: 1
Mathematics, 22.06.2019 02:30
Atrain traveled for 1.5 hours to the first station, stopped for 30 minutes, then traveled for 4 hours to the final station where it stopped for 1 hour. the total distance traveled is a function of time. which graph most accurately represents this scenario? a graph is shown with the x-axis labeled time (in hours) and the y-axis labeled total distance (in miles). the line begins at the origin and moves upward for 1.5 hours. the line then continues upward at a slow rate until 2 hours. from 2 to 6 hours, the line continues quickly upward. from 6 to 7 hours, it moves downward until it touches the x-axis a graph is shown with the axis labeled time (in hours) and the y axis labeled total distance (in miles). a line is shown beginning at the origin. the line moves upward until 1.5 hours, then is a horizontal line until 2 hours. the line moves quickly upward again until 6 hours, and then is horizontal until 7 hours a graph is shown with the axis labeled time (in hours) and the y-axis labeled total distance (in miles). the line begins at the y-axis where y equals 125. it is horizontal until 1.5 hours, then moves downward until 2 hours where it touches the x-axis. the line moves upward until 6 hours and then moves downward until 7 hours where it touches the x-axis a graph is shown with the axis labeled time (in hours) and the y-axis labeled total distance (in miles). the line begins at y equals 125 and is horizontal for 1.5 hours. the line moves downward until 2 hours, then back up until 5.5 hours. the line is horizontal from 5.5 to 7 hours
Answers: 1
You know the right answer?
Questions
Mathematics, 10.12.2020 02:30


French, 10.12.2020 02:30
English, 10.12.2020 02:30

World Languages, 10.12.2020 02:30
History, 10.12.2020 02:30
Mathematics, 10.12.2020 02:30
Mathematics, 10.12.2020 02:30
Mathematics, 10.12.2020 02:30
Mathematics, 10.12.2020 02:30
Mathematics, 10.12.2020 02:30


Law, 10.12.2020 02:30


