
Mathematics, 24.07.2020 20:01 oliviaciscooc
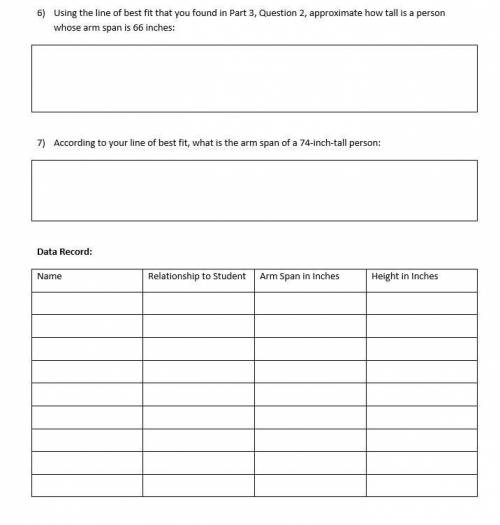
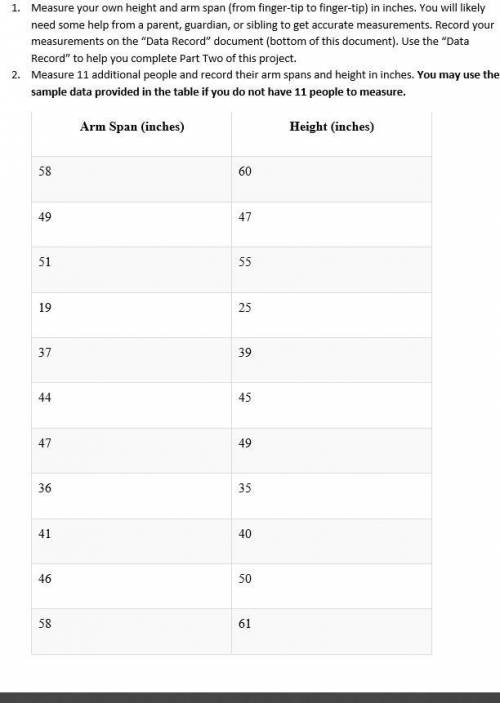
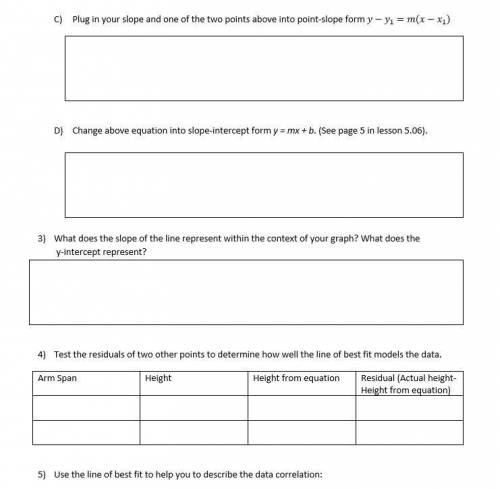
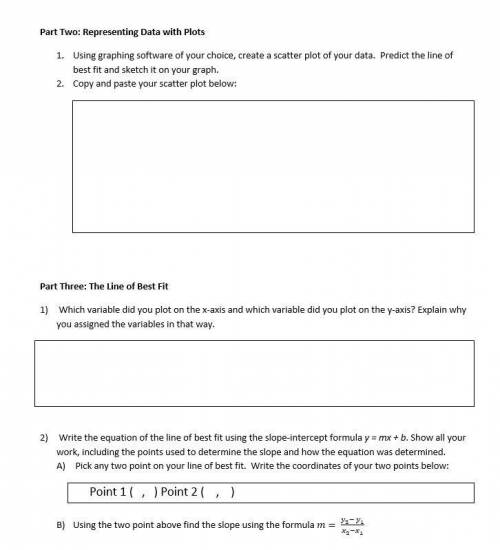
Part One: Measurements Measure your own height and arm span (from finger-tip to finger-tip) in inches. You will likely need some help from a parent, guardian, or sibling to get accurate measurements. Record your measurements on the “Data Record” document (bottom of this document). Use the “Data Record” to help you complete Part Two of this project. Measure 11 additional people and record their arm spans and height in inches. You may use the sample data provided in the table if you do not have 11 people to measure. Arm Span (inches) Height (inches) 58 60 49 47 51 55 19 25 37 39 44 45 47 49 36 35 41 40 46 50 58 61 Part Two: Representing Data with Plots Using graphing software of your choice, create a scatter plot of your data. Predict the line of best fit and sketch it on your graph. Copy and paste your scatter plot below: Part Three: The Line of Best Fit Which variable did you plot on the x-axis and which variable did you plot on the y-axis? Explain why you assigned the variables in that way. Write the equation of the line of best fit using the slope-intercept formula y = mx + b. Show all your work, including the points used to determine the slope and how the equation was determined. Pick any two point on your line of best fit. Write the coordinates of your two points below: Point 1 ( , ) Point 2 ( , ) Using the two point above find the slope using the formula m= (y_2- y_1)/(x_2-x_1 ) Plug in your slope and one of the two points above into point-slope form y-y_1=m(x-x_1) Change above equation into slope-intercept form y = mx + b. (See page 5 in lesson 5.06). What does the slope of the line represent within the context of your graph? What does the y-intercept represent? Test the residuals of two other points to determine how well the line of best fit models the data. Arm Span Height Height from equation Residual (Actual height-Height from equation) Use the line of best fit to help you to describe the data correlation: Using the line of best fit that you found in Part 3, Question 2, approximate how tall is a person whose arm span is 66 inches: According to your line of best fit, what is the arm span of a 74-inch-tall person: Data Record: Name Relationship to Student Arm Span in Inches Height in Inches

Answers: 3
Another question on Mathematics
Mathematics, 21.06.2019 18:00
Sarah used her calculator to find sin 125 degrees. she wrote down sin sin125 degrees.57. how could sarah recognize that her answer is incorrect?
Answers: 1
Mathematics, 21.06.2019 21:30
On #16 : explain how factoring a trinomial, ax^2+ bx+ c, when a does not equal 1 different from factoring a trinomial when a = 1.
Answers: 2
Mathematics, 21.06.2019 22:00
The serenity and the mystic are sail boats. the serenity and the mystic start at the same point and travel away from each other in opposite directions. the serenity travels at 16 mph and the mystic travels at 19 mph. how far apart will they be in 3 hours?
Answers: 1
Mathematics, 21.06.2019 23:40
Let x = a + bi and y = c + di and z = f + gi. which statements are true?
Answers: 1
You know the right answer?
Part One: Measurements Measure your own height and arm span (from finger-tip to finger-tip) in inche...
Questions
Mathematics, 31.05.2021 03:20

Mathematics, 31.05.2021 03:20


Social Studies, 31.05.2021 03:20

Computers and Technology, 31.05.2021 03:20
Mathematics, 31.05.2021 03:20

Engineering, 31.05.2021 03:20
Mathematics, 31.05.2021 03:20
English, 31.05.2021 03:20
Mathematics, 31.05.2021 03:20
Mathematics, 31.05.2021 03:20
Mathematics, 31.05.2021 03:20


