
Mathematics, 24.07.2020 08:01 yzafer9308
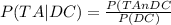
5. A 2011 study by The National Safety Council estimated that there are nearly 5.7 million traffic accidents year. At least 28% of them involved distracted drivers using cell phones or texting. The data showed that 11% of drivers at any time are using cell phones . Car insurance companies base their policy rates on accident data that shows drivers have collisions approximately once every 19 years. That’s a 5.26% chance per year. Given what you know about probability, determine if cell phone use while driving and traffic accidents are related. Step A: Let DC = event that a randomly selected driver is using a cell phone. What is P(DC)? (1 point) Step B: Let TA = event that a randomly selected driver has a traffic accident. What is P(TA)? Hint: What is the probability on any given day? (1 point) Step C: How can you determine if cell phone use while driving and traffic accidents are related? (1 point) Step D: Given that the driver has an accident, what is the probability that the driver was distracted by a cell phone? Write this event with the correct conditional notation. (1 point) Step E: What is the probability that a randomly selected driver will be distracted by using a cell phone and have an accident? (2 points) Step F: For a randomly selected driver, are the events "driving while using a cell phone" and "having a traffic accident" independent events? Explain your answer. (2 points)

Answers: 3

 ⇒ P(DC∩TA)= P(TA|DC)*P(DC)= 0.28 * 0.11= 0.0308
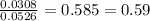
Another question on Mathematics
Mathematics, 21.06.2019 19:00
Which values of p and q result in an equation with exactly one solution? px-43=-42x+q choose all answers that apply: a) p=-43 and q=-43 b) p=42 and q=43 c) p=43 and q=−42 d) p=42 and q=42
Answers: 1
Mathematics, 22.06.2019 04:00
You make a necklace using blue, purple, and green beads in a ration of 1: 1: 2. you use the total of 168 beads. how many green beads in the necklace?
Answers: 1
Mathematics, 22.06.2019 07:20
The dot plot below shows the number of toys 21 shops sold in an hour: dot plot labeled number of toys sold shows 6 dots over 0, 4 dots over 1, 3 dots over 2, 3 dots over 3, 2 dot over 4 and 3 dots over 9 is the median or the mean a better center for this data and why? median; because the data is not symmetric and there are outliers median; because the data is symmetric and there are no outliers mean; because the data is symmetric and there are no outliers mean; because the data is skewed and there are outliers
Answers: 2
You know the right answer?
5. A 2011 study by The National Safety Council estimated that there are nearly 5.7 million traffic a...
Questions

Advanced Placement (AP), 03.02.2020 11:45


Mathematics, 03.02.2020 11:45
Mathematics, 03.02.2020 11:45


Mathematics, 03.02.2020 11:45


