Help me please !!?
The frequency table for daily sales of 100 a sale unit is given below:
dai...

Mathematics, 16.07.2020 18:01 HopeDied
Help me please !!?
The frequency table for daily sales of 100 a sale unit is given below:
daily sales
10 - 19
20 - 29
30 – 39
40 - 49
50 - 59
60 - 70
No. sale unit
4
15
27
26
18
10
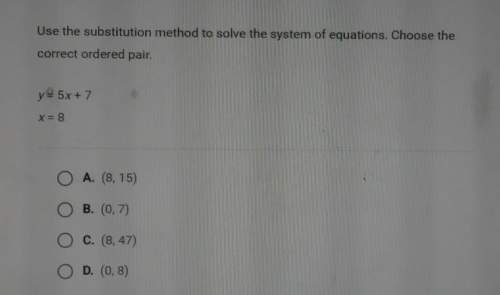
a) Construct a histogram, polygon of daily sales
b) Describe the shape of the frequency distribution.
c) Draw an ogive of daily sales, and use it to estimate, the median.
e) Estimate the following statistical measures
1. Mean
2. Median
3. Mode
4. Range
5. 15th percentile
6. Interquartile Range
7. Variance
8. Standard deviation
9. Coefficient of variation

Answers: 3
Another question on Mathematics
Mathematics, 21.06.2019 17:30
What is not true about kl and mn? what is mn? (show your work)
Answers: 1
Mathematics, 21.06.2019 18:00
Ammonia molecules have three hydrogen atoms and one nitrogen atom.how many of each atom arein five molecules of ammonia
Answers: 1
You know the right answer?
Questions

Mathematics, 09.04.2020 23:55


Chemistry, 09.04.2020 23:56

Mathematics, 09.04.2020 23:56
English, 09.04.2020 23:56
Mathematics, 09.04.2020 23:56


