
Mathematics, 15.07.2020 03:01 hihihi129473838
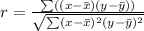
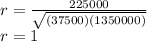
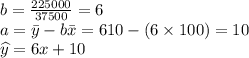
A manager is assessing the correlation between the number of employees in a plant and the number of products produced yearly. The table shows the data: Number of employees (x) 0 25 50 75 100 125 150 175 200 Number of products (y) 10 160 310 460 610 760 910 1060 1210 Part A: Is there any correlation between the number of employees in the plant and the number of products produced yearly? Justify your answer. (4 points) Part B: Write a function that best fits the data. (3 points) Part C: What does the slope and y-intercept of the plot indicate?

Answers: 2


Another question on Mathematics
Mathematics, 21.06.2019 18:00
The only way to identify an intercept is as an ordered pair. true false
Answers: 1
Mathematics, 21.06.2019 19:00
Tabby sells clothing at a retail store, and she earns a commission of 6.25% on all items she sells. last week she sold a pair of jeans for $32.50, a skirt for $18.95, and 2 blouses for $14.95 each. what was tabby's total commission? a $4.15 b $5.08 c $81.35 d $348.60
Answers: 3
Mathematics, 21.06.2019 21:00
Roger could feed 5 walruses with 4 kilograms of fish. how many walruses could he feed with 7.2 kilograms of fish?
Answers: 1
Mathematics, 22.06.2019 02:10
Of to(3, 4) (2,1) (3,7) (5,2) (5,-2) (3, 3) (-2, 3) (1,2) (-4,-2) (-3, 1) (4, -1) (-1, 1) 10 v 29
Answers: 1
You know the right answer?
A manager is assessing the correlation between the number of employees in a plant and the number of...
Questions
Mathematics, 25.03.2021 01:00
Mathematics, 25.03.2021 01:00
Mathematics, 25.03.2021 01:00

Geography, 25.03.2021 01:00

English, 25.03.2021 01:00


Health, 25.03.2021 01:00
Mathematics, 25.03.2021 01:00
Mathematics, 25.03.2021 01:00

History, 25.03.2021 01:00
Mathematics, 25.03.2021 01:00
Mathematics, 25.03.2021 01:00
History, 25.03.2021 01:00
Mathematics, 25.03.2021 01:00


